McDonalds 2007 Annual Report Download - page 26
Download and view the complete annual report
Please find page 26 of the 2007 McDonalds annual report below. You can navigate through the pages in the report by either clicking on the pages listed below, or by using the keyword search tool below to find specific information within the annual report.-
 1
1 -
2
-
3
-
4
-
5
-
6
-
7
-
8
-
9
-
10
-
11
-
12
-
13
-
14
-
15
-
 16
16 -
 17
17 -
 18
18 -
 19
19 -
 20
20 -
 21
21 -
 22
22 -
 23
23 -
 24
24 -
 25
25 -
 26
26 -
 27
27 -
 28
28 -
 29
29 -
 30
30 -
 31
31 -
 32
32 -
 33
33 -
 34
34 -
 35
35 -
 36
36 -
37
-
38
-
39
-
40
-
41
-
42
-
43
-
44
-
45
-
46
-
47
-
48
-
49
-
50
-
51
-
52
-
53
-
54
-
55
-
56
-
57
-
58
-
59
-
60
-
61
-
62
-
63
-
64
-
65
-
66
-
67
-
68
 |
 |

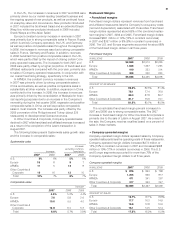
OVERVIEW
Description of the business
The Company primarily franchises and operates McDonald’s
restaurants. Of the 31,377 restaurants in 118 countries at year-
end 2007, 20,505 are operated by franchisees (including 2,781
operated by developmental licensees), 3,966 are operated by
affi liates and 6,906 are operated by the Company. Under our
conventional franchise arrangement, franchisees provide a
portion of the required capital by initially investing in the
equipment, signs, seating and décor of their restaurant busi-
nesses, and by reinvesting in the business over time. The
Company owns the land and building or secures long-term
leases for both Company-operated and conventional franchised
restaurant sites. This ensures long-term occupancy rights,
helps control related costs and improves alignment with
franchisees. Under our developmental license arrangement,
licensees provide capital for the entire business, including the
real estate interest, while the Company generally has no
capital invested.
We view ourselves primarily as a franchisor and continually
review our restaurant ownership mix (that is, our mix among
Company-operated, franchised, conventional or developmental
license, and affi liated) to deliver a great customer experience
and drive profi tability. In most cases, franchising is the best
way to achieve both goals. Although direct restaurant operation
is more capital-intensive relative to franchising and results in
lower restaurant margins as a percent of revenues, Company-
operated restaurants are important to our success in both
mature and developing markets. In our Company-operated
restaurants, and in collaboration with our franchisees, we further
develop and refi ne operating standards, marketing concepts
and product and pricing strategies, so that only those that we
believe are most benefi cial are introduced Systemwide. In ad-
dition, we fi rmly believe that owning restaurants is paramount to
being a credible franchisor and essential to providing Company
personnel with restaurant operations experience. Our Company-
operated business also helps to facilitate changes in restaurant
ownership as warranted by strategic considerations.
Revenues consist of sales by Company-operated restaurants
and fees from restaurants operated by franchisees and affi li-
ates. These fees primarily include rent and/or royalties that are
based on a percent of sales, with specifi ed minimum rent pay-
ments, along with initial fees. Fees vary by type of site, amount
of Company investment and local business conditions. These
fees, along with occupancy and operating rights, are stipulated
in franchise/license agreements that generally have 20-year
terms.
The business is managed as distinct geographic segments.
Signifi cant reportable segments include the United States (U.S.),
Europe, and Asia/Pacifi c, Middle East and Africa (APMEA). In
addition, throughout this report we present “Other Countries &
Corporate” that includes operations in Canada and Latin Amer-
ica, as well as Corporate activities and certain investments. The
U.S., Europe and APMEA segments account for 35%, 39% and
16% of total revenues, respectively. France, Germany and the
United Kingdom (U.K.), collectively, account for approximately
60% of Europe’s revenues; and Australia, China and Japan
(a 50%-owned affi liate accounted for under the equity method),
collectively, account for over 50% of APMEA’s revenues. These
six markets along with the U.S. and Canada are referred to as
“major markets” throughout this report and comprise over 70%
of total revenues.
The Company continues to focus its management and
fi nancial resources on the McDonald’s restaurant business
as we believe the opportunities for long-term growth remain
signifi cant. Accordingly, during the third quarter 2007, the
Company sold its investment in Boston Market. In 2006, the
Company disposed of its investment in Chipotle Mexican Grill
(Chipotle) via public stock offerings and a tax-free exchange for
McDonald’s common stock. As a result of the disposals during
2007 and 2006, both Boston Market’s and Chipotle’s results
of operations and transaction gains have been refl ected as
discontinued operations for all periods presented.
In analyzing business trends, management considers a
variety of performance and fi nancial measures including
comparable sales growth, Systemwide sales growth,
restaurant margins and returns.
• Constant currency results exclude the effects of foreign
currency translation and are calculated by translating current
year results at prior year average exchange rates. Management
reviews and analyzes business results in constant currencies
and bases certain compensation plans on these results
because we believe they better represent the underlying
business trends.
• Comparable sales are a key performance indicator used
within the retail industry and are indicative of acceptance
of the Company’s initiatives as well as local economic and
consumer trends. Increases or decreases in comparable
sales represent the percent change in constant currency
sales from the same period in the prior year for all restaurants
in operation at least thirteen months, including those tem-
porarily closed. Some of the reasons restaurants may be
temporarily closed include road construction, reimaging or
remodeling, rebuilding, and natural disasters. McDonald’s
reports on a calendar basis and therefore the comparability
of the same month, quarter and year with the corresponding
period of the prior year will be impacted by the mix of days.
The number of weekdays, weekend days and timing of
holidays in a given timeframe can have a positive or negative
impact on comparable sales. The Company refers to this
impact as the calendar shift/trading day adjustment. This
impact varies geographically due to consumer spending
patterns and has the greatest impact on monthly comparable
sales. Typically, the annual impact is minimal, with the
exception of leap years.
• Systemwide sales include sales at all restaurants, whether
operated by the Company, by franchisees or by affi liates.
While sales by franchisees and affi liates are not recorded
as revenues by the Company, management believes the
information is important in understanding the Company’s
fi nancial performance because it is the basis on which the
Company calculates and records franchised and affi liated
revenues and is indicative of the fi nancial health of our
franchisee base.
MANAGEMENT’S DISCUSSION AND ANALYSIS OF FINANCIAL CONDITION AND RESULTS OF OPERATIONS
24