McDonalds 2007 Annual Report Download - page 40
Download and view the complete annual report
Please find page 40 of the 2007 McDonalds annual report below. You can navigate through the pages in the report by either clicking on the pages listed below, or by using the keyword search tool below to find specific information within the annual report.-
 1
1 -
2
-
3
-
4
-
5
-
6
-
7
-
8
-
9
-
10
-
11
-
12
-
13
-
14
-
15
-
16
-
17
-
18
-
19
-
20
-
21
-
22
-
23
-
24
-
25
-
26
-
27
-
28
-
29
-
 30
30 -
 31
31 -
 32
32 -
 33
33 -
 34
34 -
 35
35 -
 36
36 -
 37
37 -
 38
38 -
 39
39 -
 40
40 -
 41
41 -
 42
42 -
 43
43 -
 44
44 -
 45
45 -
 46
46 -
 47
47 -
 48
48 -
 49
49 -
 50
50 -
51
-
52
-
53
-
54
-
55
-
56
-
57
-
58
-
59
-
60
-
61
-
62
-
63
-
64
-
65
-
66
-
67
-
68
 |
 |

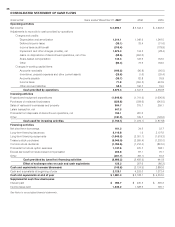
the Company’s focus on growing sales at existing restaurants,
including reinvestment initiatives such as reimaging in several
markets around the world. Capital expenditures related to dis-
continued operations were $10 million, $82 million and
$110 million in 2007, 2006 and 2005, respectively. The
expenditures in 2007 primarily related to investment in existing
Boston Market restaurants and expenditures in 2006 and 2005,
primarily related to new Chipotle restaurants.
Capital expenditures invested in major markets, excluding
Japan, represented approximately 75% of the total in 2007 and
about 70% of the total in 2006 and 2005. Japan is accounted
for under the equity method, and accordingly its capital expen-
ditures are not included in consolidated amounts.
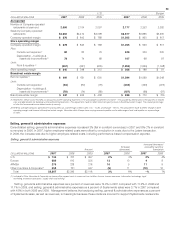
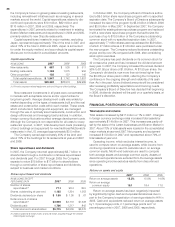
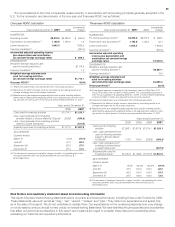
Capital expenditures
IN MILLIONS
2007 2006 2005
New restaurants $ 687 $ 530 $ 511
Existing restaurants 1,158 1,075 950
Other properties
(1)
102 137 146
Total capital expenditures $ 1,947 $ 1,742 $ 1,607
Total assets $29,392 $28,974 $29,989
(1) Primarily corporate-related equipment and furnishings for offi ce buildings.
New restaurant investments in all years were concentrated
in markets with acceptable returns and/or opportunities for
long-term growth. Average development costs vary widely by
market depending on the types of restaurants built and the real
estate and construction costs within each market. These costs,
which include land, buildings and equipment, are managed
through the use of optimally sized restaurants, construction and
design effi ciencies and leveraging best practices. In addition,
foreign currency fl uctuations affect average development costs.
Although the Company is not responsible for all costs for every
restaurant opened, in 2007, total development costs (consisting
of land, buildings and equipment) for new traditional McDonald’s
restaurants in the U.S. averaged approximately $2.5 million.
The Company owned approximately 45% of the land and
about 70% of the buildings for its restaurants at year-end 2007
and 2006.
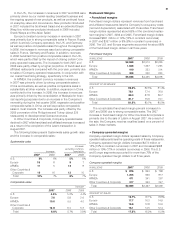
Share repurchases and dividends
In 2007, the Company returned approximately $5.7 billion to
shareholders through a combination of shares repurchased
and dividends paid. For 2007 through 2009, the Company
expects to return $15 billion to $17 billion to shareholders
through a combination of share repurchases and dividends,
subject to business and market conditions.
Shares repurchased and dividends
IN MILLIONS, EXCEPT
PER SHARE DATA
2007 2006 2005
Number of shares
repurchased
(1)
77.1 98.4 39.5
Shares outstanding at year end 1,165 1,204 1,263
Dividends declared per share $ 1.50 $ 1.00 $ .67
Dollar amount of shares
repurchased
(1)
$3,949 $3,719 $1,228
Dividends paid 1,766 1,217 842
Total returned to shareholders $5,715 $4,936 $2,070
(1) 2006 included 18.6 million shares or $743.6 million acquired through the October
2006 Chipotle exchange.
In October 2001, the Company’s Board of Directors author-
ized a $5.0 billion share repurchase program with no specifi ed
expiration date. The Company’s Board of Directors subsequently
increased the size of the program by $5.0 billion in March 2006
and $3.0 billion in May 2007. In September 2007, the Company
terminated the existing share repurchase program and replaced
it with a new share repurchase program that authorizes the
purchase of up to $10.0 billion of the Company’s outstanding
common stock with no specifi ed expiration date. In 2007,
approximately 77 million shares were repurchased for $3.9 billion,
of which 27 million shares or $1.6 billion were purchased under
the new program. The Company reduced its shares outstanding
at year end by over 3% compared with 2006, after considering
stock option exercises.
The Company has paid dividends on its common stock for
32 consecutive years and has increased the dividend amount
every year. In 2007, the Company increased the annual dividend
50% to $1.50 per share or $1.8 billion. At $1.50 per share, the
Company’s dividend is now more than six times higher than
the $0.235 per share paid in 2002, refl ecting the Company’s
confi dence in the ongoing strength and reliability of its cash
fl ow. As in the past, future dividend amounts will be considered
after reviewing profi tability expectations and fi nancing needs.
The Company’s Board of Directors has decided that beginning
in 2008, dividends declared will be paid on a quarterly basis, at
the Board’s discretion.
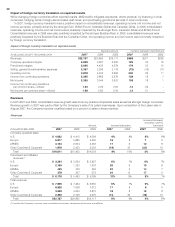
FINANCIAL POSITION AND CAPITAL RESOURCES
Total assets and returns
Total assets increased by $417 million or 1% in 2007. Changes
in foreign currency exchange rates increased total assets by
approximately $1.4 billion in 2007. This increase was partly off-
set by the sales of the Latam businesses and Boston Market in
2007. About 70% of total assets were located in the consolidated
major markets at year-end 2007. Net property and equipment
increased $1.5 billion in 2007 and represented about 70% of
total assets at year end.
Operating income, which excludes interest income, is
used to compute return on average assets, while income from
continuing operations is used to calculate return on average
common equity. Month-end balances are used to compute
both average assets and average common equity. Assets of
discontinued operations are excluded from the average assets
since operating income excludes results from discontinued
operations.
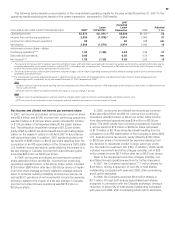
Returns on assets and equity
2007 2006 2005
Return on average assets 13.2% 15.0% 14.6%
Return on average
common equity 15.1 18.4 17.6
Return on average assets has been negatively impacted
by signifi cantly higher cash and equivalents balances due in
part to the Company’s repatriation of earnings related to HIA in
2005. Cash and equivalents reduced return on average assets
by 1.3 percentage points, 2.1 percentage points and 1.2
percentage points in 2007, 2006 and 2005, respectively.
38