McDonalds 2007 Annual Report Download - page 50
Download and view the complete annual report
Please find page 50 of the 2007 McDonalds annual report below. You can navigate through the pages in the report by either clicking on the pages listed below, or by using the keyword search tool below to find specific information within the annual report.-
 1
1 -
2
-
3
-
4
-
5
-
6
-
7
-
8
-
9
-
10
-
11
-
12
-
13
-
14
-
15
-
16
-
17
-
18
-
19
-
20
-
21
-
22
-
23
-
24
-
25
-
26
-
27
-
28
-
29
-
30
-
31
-
32
-
33
-
34
-
35
-
36
-
37
-
38
-
39
-
 40
40 -
 41
41 -
 42
42 -
 43
43 -
 44
44 -
 45
45 -
 46
46 -
 47
47 -
 48
48 -
 49
49 -
 50
50 -
 51
51 -
 52
52 -
 53
53 -
 54
54 -
 55
55 -
 56
56 -
 57
57 -
 58
58 -
 59
59 -
 60
60 -
61
-
62
-
63
-
64
-
65
-
66
-
67
-
68
 |
 |

NOTES TO CONSOLIDATED FINANCIAL STATEMENTS
SUMMARY OF SIGNIFICANT ACCOUNTING POLICIES
Nature of business
The Company primarily franchises and operates McDonald’s
restaurants in the food service industry. The Company also has
a minority ownership in U.K.-based Pret A Manger. Prior to August
2007, the Company operated Boston Market in the U.S., which
it sold in 2007. Prior to October 2006, the Company had an
ownership interest in Chipotle Mexican Grill (Chipotle). During
2006, the Company disposed of its investment in Chipotle.
All restaurants are operated either by the Company, by
independent entrepreneurs under the terms of franchise
arrangements (franchisees), or by affi liates and develop-
mental licensees operating under license agreements.
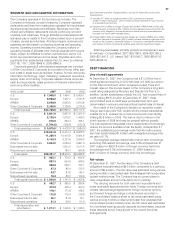
The following table presents restaurant information by
ownership type:
Restaurants at December 31,
2007 2006 2005
Operated by franchisees
(1)
20,505 18,685 18,324
Operated by the Company 6,906 8,166 8,173
Operated by affi liates 3,966 4,195 4,269
Systemwide restaurants 31,377 31,046 30,766
(1) Includes restaurants operated by developmental licensees.
Consolidation
The consolidated fi nancial statements include the accounts
of the Company and its subsidiaries. Investments in affi liates
owned 50% or less (primarily McDonald’s Japan) are accounted
for by the equity method.
Estimates in fi nancial statements
The preparation of fi nancial statements in conformity with
accounting principles generally accepted in the U.S. requires
management to make estimates and assumptions that affect
the amounts reported in the fi nancial statements and accompa-
nying notes. Actual results could differ from those estimates.
Reclassifi cations
Certain prior period amounts have been reclassifi ed to conform
to current year presentation, including reclassifying amounts
related to businesses sold in Latin America to assets (primarily
property and equipment) and liabilities of businesses held for
sale and reclassifying results and amounts from Boston Market
to discontinued operations. In addition, throughout this report,
we present as Other Countries & Corporate, the previously
reported segments of Latin America, Canada and Corporate
& Other.
Revenue recognition
The Company’s revenues consist of sales by Company-
operated restaurants and fees from restaurants operated by
franchisees/licensees and affi liates. Sales by Company-operated
restaurants are recognized on a cash basis. The Company
presents sales net of sales tax and other sales-related taxes.
Revenues from franchised and affi liated restaurants include
continuing rent and royalties, and initial fees. Foreign affi liates
and developmental licensees pay a royalty to the Company
based upon a percent of sales, as well as initial fees.
Continuing rent and royalties are recognized in the period
earned. Initial fees are recognized upon opening of a restaurant,
which is when the Company has performed substantially all
initial services required by the franchise arrangement.
Foreign currency translation
The functional currency of substantially all operations outside
the U.S. is the respective local currency.
Advertising costs
Advertising costs included in expenses of Company-operated
restaurants primarily consist of contributions to advertising
cooperatives and were (in millions): 2007–$718.3; 2006–
$669.8; 2005–$611.2. Production costs for radio and television
advertising are expensed when the commercials are initially
aired. These production costs, primarily in the U.S., as well as
other marketing-related expenses included in selling, general
& administrative expenses were (in millions): 2007–$87.7;
2006–$97.4; 2005–$116.7. In addition, signifi cant advertising
costs are incurred by franchisees through separate advertising
cooperatives in individual markets.
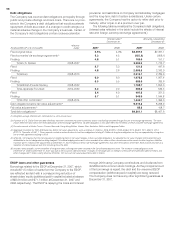
Share-based compensation
Effective January 1, 2005, the Company adopted the fair value
recognition provisions of the Statement of Financial Accounting
Standards No. 123(R), Share-Based Payment (SFAS No. 123(R)),
using the modifi ed-prospective transition method. Under this
transition method, compensation cost beginning in 2005
includes the portion vesting in the period for (i) all share-based
payments granted prior to, but not vested as of January 1,
2005, based on the grant date fair value estimated in accord-
ance with the original provisions of the Statement of Financial
Accounting Standards No. 123, Accounting for Stock-Based
Compensation and (ii) all share-based payments granted subse-
quent to January 1, 2005, based on the grant date fair value es-
timated in accordance with the provisions of SFAS No. 123(R).
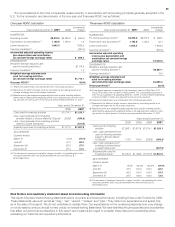
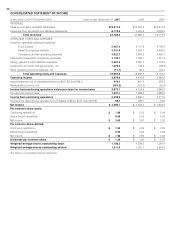
Share-based compensation expense and the effect on
diluted net income per common share were as follows:
IN MILLIONS, EXCEPT PER SHARE DATA
2007 2006 2005
Share-based compensation expense $142.4 $122.5 $152.0
After tax $ 94.9 $ 82.6 $102.3
Net income per common share-diluted $ 0.07 $ 0.07 $ 0.08
Compensation expense related to share-based awards
is generally amortized on a straight-line basis over the vesting
period in selling, general & administrative expenses in the
Consolidated statement of income. As of December 31, 2007,
there was $122.0 million of total unrecognized compensation cost
related to nonvested share-based compensation that is expected
to be recognized over a weighted-average period of 2.0 years.
The fair value of each stock option granted is estimated on
the date of grant using a closed-form pricing model. The following
table presents the weighted-average assumptions used in the
option pricing model for the 2007, 2006 and 2005 stock option
grants. The expected life of the options represents the period of
time the options are expected to be outstanding and is based
on historical trends. Expected stock price volatility is generally
based on the historical volatility of the Company’s stock for a
48