McDonalds 2007 Annual Report Download - page 49
Download and view the complete annual report
Please find page 49 of the 2007 McDonalds annual report below. You can navigate through the pages in the report by either clicking on the pages listed below, or by using the keyword search tool below to find specific information within the annual report.-
 1
1 -
2
-
3
-
4
-
5
-
6
-
7
-
8
-
9
-
10
-
11
-
12
-
13
-
14
-
15
-
16
-
17
-
18
-
19
-
20
-
21
-
22
-
23
-
24
-
25
-
26
-
27
-
28
-
29
-
30
-
31
-
32
-
33
-
34
-
35
-
36
-
37
-
38
-
 39
39 -
 40
40 -
 41
41 -
 42
42 -
 43
43 -
 44
44 -
 45
45 -
 46
46 -
 47
47 -
 48
48 -
 49
49 -
 50
50 -
 51
51 -
 52
52 -
 53
53 -
 54
54 -
 55
55 -
 56
56 -
 57
57 -
 58
58 -
 59
59 -
60
-
61
-
62
-
63
-
64
-
65
-
66
-
67
-
68
 |
 |

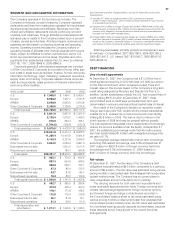
CONSOLIDATED STATEMENT OF SHAREHOLDERS’ EQUITY
IN MILLIONS,
EXCEPT PER
SHARE DATA
Balance at December 31, 2004 1,660.6 $ 16.6 $ 2,103.2 $ 21,755.8 $ – $(15.7) $ (80.3) (390.7) $ (9,578.1) $ 14,201.5
Net income 2,602.2 2,602.2
Translation adjustments
(including taxes of $189.6) (634.3) (634.3)
Fair value adjustments–cash
fl ow hedges (including
taxes of $5.6) (2.8) (2.8)
Comprehensive income 1,965.1
Common stock cash dividends
($.67 per share) (842.0) (842.0)
ESOP loan payment 7.0 7.0
Treasury stock purchases (39.5) (1,228.1) (1,228.1)
Share-based compensation 152.0 152.0
Stock option exercises and
other (including tax benefi ts
of $86.9) 458.0 32.8 432.6 890.6
Balance at December 31, 2005 1,660.6 16.6 2,720.2 23,516.0 – (18.5) (714.6) (397.4) (10,373.6) 15,146.1
Net income 3,544.2 3,544.2
Translation adjustments
(including taxes of $95.6) 514.7 514.7
Fair value adjustments–cash
fl ow hedges (including tax
benefi ts of $0.6) 10.7 10.7
Comprehensive income 4,069.6
Adjustment to initially apply
SFAS No. 158 (including
tax benefi ts of $39.2) (89.0) (89.0)
Common stock cash dividends
($1.00 per share) (1,216.5) (1,216.5)
ESOP loan payment 7.3 7.3
Treasury stock purchases (98.4) (3,718.9) (3,718.9)
Share-based compensation 122.5 122.5
Stock option exercises and
other (including tax benefi ts
of $125.4) 595.0 1.9 38.9 540.3 1,137.2
Balance at December 31, 2006 1,660.6 16.6 3,445.0 25,845.6 (89.0) (7.8) (199.9) (456.9) (13,552.2) 15,458.3
Net income 2,395.1 2,395.1
Translation adjustments
(including taxes of $41.7) 804.8 804.8
Latam historical translation
adjustments 769.5 769.5
Fair value adjustments–cash
fl ow hedges (including taxes
of $2.9) 8.5 8.5
Adjustments related to pensions
(including taxes of $19.7) 51.3 51.3
Comprehensive income 4,029.2
Common stock cash dividends
($1.50 per share) (1,765.6) (1,765.6)
ESOP loan payment 7.6 7.6
Treasury stock purchases (77.1) (3,948.8) (3,948.8)
Share-based compensation 142.4 142.4
Adjustment to initially apply
EITF 06-2 (including tax
benefi ts of $18.1) (36.1) (36.1)
Adjustment to initially
apply FIN 48 20.1 20.1
Stock option exercises and
other (including tax benefi ts
of $246.8) 631.7 2.4 38.7 738.6 1,372.7
Balance at December 31, 2007 1,660.6 $16.6 $4,226.7 $26,461.5 $(37.7) $ 0.7 $1,374.4 (495.3) $(16,762.4) $15,279.8
See Notes to consolidated fi nancial statements.
Common stock
issued Additional
paid-in
capital
Retained
earnings
Accumulated other
comprehensive income (loss)
Total
shareholders’
equity
Pensions
Deferred
hedging
adjustment
Foreign
currency
translation
Shares Amount
Common stock
in treasury
Shares Amount
47