McDonalds 2007 Annual Report Download - page 37
Download and view the complete annual report
Please find page 37 of the 2007 McDonalds annual report below. You can navigate through the pages in the report by either clicking on the pages listed below, or by using the keyword search tool below to find specific information within the annual report.-
 1
1 -
2
-
3
-
4
-
5
-
6
-
7
-
8
-
9
-
10
-
11
-
12
-
13
-
14
-
15
-
16
-
17
-
18
-
19
-
20
-
21
-
22
-
23
-
24
-
25
-
26
-
 27
27 -
 28
28 -
 29
29 -
 30
30 -
 31
31 -
 32
32 -
 33
33 -
 34
34 -
 35
35 -
 36
36 -
 37
37 -
 38
38 -
 39
39 -
 40
40 -
 41
41 -
 42
42 -
 43
43 -
 44
44 -
 45
45 -
 46
46 -
 47
47 -
48
-
49
-
50
-
51
-
52
-
53
-
54
-
55
-
56
-
57
-
58
-
59
-
60
-
61
-
62
-
63
-
64
-
65
-
66
-
67
-
68
 |
 |

In 2007 and 2006, U.S. operating income included higher com-
bined restaurant margin dollars compared to 2006 and 2005,
respectively.
In Europe, results for 2007 were driven by strong perform-
ance in France, the U.K. and Russia, as well as positive results
in most other markets. Impairment and other charges (credits)
benefi ted the growth rate in 2007. In 2006, results refl ected
strong performance in France and a gain on the sale of an
offi ce building in Russia, partly offset by impairment and other
charges. In addition, operating results in the U.K. and Germany
contributed to the 2006 increase in operating income.
In APMEA, results for 2007 were driven by improved results
in China, Japan, Australia, Hong Kong and most other markets.
Results for 2006 refl ected strong performance in Australia as
well as improved results in China and Japan, partly offset by
impairment and other charges.
In Other Countries & Corporate, results for 2007 and 2006
refl ected strong sales performance across most markets in
Latin America. Results for 2006 also refl ected higher perform-
ance-based compensation, as well as costs related to our
biennial worldwide owner/operator convention.
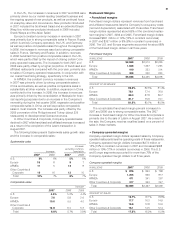
• Combined operating margin
Combined operating margin is defi ned as operating income
as a percent of total revenues. Combined operating margin
for 2007, 2006 and 2005 was 17.0%, 21.2% and 20.8%,
respectively. Impairment and other charges (credits) negatively
impacted the 2007 and 2006 combined operating margin by
7.4 percentage points and 0.7 percentage points, respectively,
and positively impacted the 2005 combined operating margin by
0.1 percentage point.
Interest expense
Interest expense for 2007 increased primarily due to higher
average interest rates and stronger foreign currencies, partly
offset by lower average debt levels. Interest expense for 2006
increased primarily due to higher average debt levels as a
result of activity related to HIA, funded by local borrowings in
late 2005, and higher average interest rates. In late 2005, the
Company repatriated approximately $3 billion of certain foreign
historical earnings under HIA.
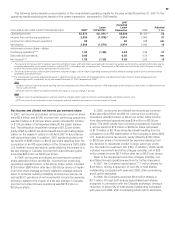
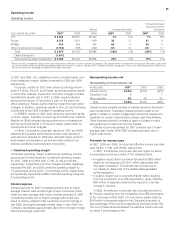
Nonoperating income, net
Nonoperating (income) expense, net
IN MILLIONS
2007 2006 2005
Interest income $(124) $(152) $(73)
Translation loss 1 – 7
Other expense 20 29 34
Total $(103) $(123) $(32)
Interest income consists primarily of interest earned on short-term
cash investments. Translation losses primarily relate to net
gains or losses on certain hedges that reduce the exposure to
variability on certain intercompany foreign cash fl ow streams.
Other expense primarily consists of gains or losses on early
extinguishment of debt and minority interest.
Interest income decreased for 2007 primarily due to lower
average cash levels, while 2006 increased primarily due to
higher cash levels.
Provision for income taxes
In 2007, 2006 and 2005, the reported effective income tax rates
were 34.6%, 31.0%, and 29.6%, respectively.
In 2007, the effective income tax rate was higher by about
4 percentage points as a result of the following items:
• A negative impact due to a minimal tax benefi t of $62 million
related to net expense of $1,641 million associated with
the Latam transaction. This benefi t was minimal due to
our inability to utilize most of the capital losses generated
by this transaction.
• A positive impact due to a benefi t of $316 million resulting
from the completion of an IRS examination, partly offset by
$28 million of expense related to the impact of a tax law
change in Canada.
In 2005, the effective income tax rate included a benefi t of
$179 million resulting from the completion of an IRS examination
of the Company’s 2000-2002 U.S. tax returns, partly offset by
$106 million of expense related to the Company’s decision to
take advantage of the one-time opportunity provided under HIA.
The net of these items decreased the effective income tax rate
by about 2 percentage points.
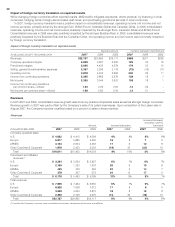
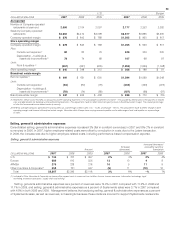
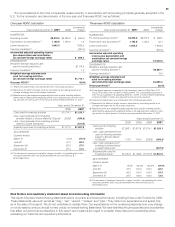
Increase/(decrease)
excluding currency
Amount
Increase/(decrease) translation
Operating income
DOLLARS IN MILLIONS
2007 2006 2005
2007 2006
2007 2006
U.S. $ 2,842 $2,657 $2,422 7% 10% 7% 10%
Europe 2,125 1,610 1,449 32 11 21 9
APMEA 616 364 345 69 6 59 9
Other Countries & Corporate (1,704) (198) (232) nm 14 nm 11
Total $ 3,879 $4,433 $3,984 (12)% 11% (18)% 11%
Latam transaction (1,641)
Total excluding Latam transaction* $ 5,520 $4,433 $3,984 25% 11% 19% 11%
*
Results for 2007 included the impact of the Latam transaction, which was in Other Countries & Corporate. This impact refl ects an impairment charge of $1,665 million, partly offset
by a benefi t of $24 million due to eliminating depreciation on the assets in Latam in mid-April 2007. In order to provide management’s view of the underlying business performance,
results are also shown excluding the impact of the Latam transaction.
Operating income
35