McDonalds 2007 Annual Report Download - page 39
Download and view the complete annual report
Please find page 39 of the 2007 McDonalds annual report below. You can navigate through the pages in the report by either clicking on the pages listed below, or by using the keyword search tool below to find specific information within the annual report.-
 1
1 -
2
-
3
-
4
-
5
-
6
-
7
-
8
-
9
-
10
-
11
-
12
-
13
-
14
-
15
-
16
-
17
-
18
-
19
-
20
-
21
-
22
-
23
-
24
-
25
-
26
-
27
-
28
-
 29
29 -
 30
30 -
 31
31 -
 32
32 -
 33
33 -
 34
34 -
 35
35 -
 36
36 -
 37
37 -
 38
38 -
 39
39 -
 40
40 -
 41
41 -
 42
42 -
 43
43 -
 44
44 -
 45
45 -
 46
46 -
 47
47 -
 48
48 -
 49
49 -
50
-
51
-
52
-
53
-
54
-
55
-
56
-
57
-
58
-
59
-
60
-
61
-
62
-
63
-
64
-
65
-
66
-
67
-
68
 |
 |

• SFAS Statement No. 159
In February 2007, the FASB issued Statement of Financial
Accounting Standards No. 159, The Fair Value Option for
Financial Assets and Financial Liabilities (SFAS No. 159). SFAS
No. 159 permits entities to voluntarily choose to measure many
fi nancial instruments and certain other items at fair value. SFAS
No. 159 is effective beginning January 1, 2008. The Company
has decided not to adopt this optional standard.
• SFAS Statement No. 141(R)
In December 2007, the FASB issued Statement of Financial
Accounting Standards No. 141(R), Business Combinations
(SFAS No. 141(R)). SFAS No. 141(R) requires the acquiring en-
tity in a business combination to record all assets acquired and
liabilities assumed at their respective acquisition-date fair values,
changes the recognition of assets acquired and liabilities as-
sumed arising from preacquisition contingencies, and requires
the expensing of acquisition-related costs as incurred. SFAS
No. 141(R) applies prospectively to business combinations for
which the acquisition date is on or after January 1, 2009. We do
not expect the adoption of SFAS No. 141(R) to have a signifi cant
impact on our consolidated fi nancial statements.
• SFAS Statement No. 160
In December 2007, the FASB issued Statement of Financial
Accounting Standards No. 160, Noncontrolling Interests in
Consolidated Financial Statements (an amendment of Accounting
Research Bulletin (ARB 51)) (SFAS No. 160). SFAS No. 160
amends ARB 51 to establish accounting and reporting stand-
ards for the noncontrolling interest in a subsidiary and for the
deconsolidation of a subsidiary. SFAS No. 160 becomes effec-
tive beginning January 1, 2009 and is required to be adopted
prospectively, except for the reclassifi cation of noncontrolling
interests to equity and the recasting of net income (loss) at-
tributable to both the controlling and noncontrolling interests,
which are required to be adopted retrospectively. We do not
expect the adoption of SFAS No. 160 to have a signifi cant
impact on our consolidated fi nancial statements.
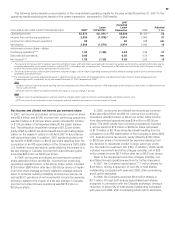
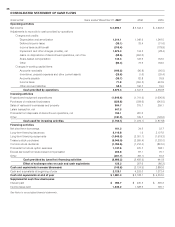
CASH FLOWS
The Company generates signifi cant cash from operations
and has substantial credit capacity to fund operating and
discretionary spending such as capital expenditures, dividends,
share repurchases and debt repayments.
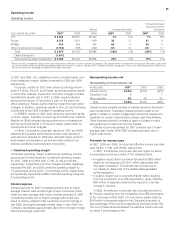
Cash provided by operations totaled $4.9 billion and
exceeded capital expenditures by $2.9 billion in 2007, while
cash provided by operations totaled $4.3 billion and exceeded
capital expenditures by $2.6 billion in 2006. In 2007, cash pro-
vided by operations increased $535 million compared to 2006
primarily due to increased operating results and lower income
tax payments. In 2006, cash provided by operations was fl at
compared to 2005 due to increased operating results, offset by
changes in working capital primarily due to higher income tax
payments.
Cash used for investing activities totaled $1.2 billion in 2007,
a decrease of $124 million compared to 2006, primarily due to
net proceeds received from the Latam transaction and the sale
of Boston Market in 2007, partly offset by higher capital expen-
ditures in 2007. Cash used for investing activities totaled $1.3
billion in 2006, a decrease of $544 million compared to 2005.
The increase in capital expenditures was more than offset by
the proceeds from the disposition of Chipotle as well as the
sales of short-term investments.
Cash used for fi nancing activities totaled $4.0 billion in 2007,
a decrease of $1.5 billion compared to 2006, primarily due to
higher net debt issuances, partly offset by higher treasury stock
purchases and an increase in the common stock dividend in
2007 compared to 2006. In 2006, cash used for fi nancing
activities totaled $5.5 billion compared to cash provided by
fi nancing activities of $442 million in 2005. The 2006 activity
refl ected higher shares repurchased, higher net debt
repayments and an increase in the common stock dividend.
As a result of the above activity, the Company’s cash and
equivalents balance decreased $147 million in 2007 to $2.0
billion, compared to a decrease of $2.1 billion in 2006.
In addition to cash and equivalents and cash provided by
operations, the Company can meet short-term funding needs
through commercial paper borrowings and line of
credit agreements.
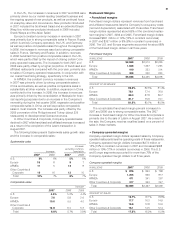
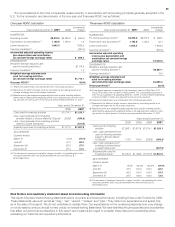
Restaurant development and capital expenditures
In 2007, the Company opened 743 traditional restaurants and
93 satellite restaurants (small, limited-menu restaurants for
which the land and building are generally leased), and closed
240 traditional restaurants and 265 satellite restaurants. In
2006, the Company opened 643 traditional restaurants and 101
satellite restaurants, and closed 284 traditional restaurants and
180 satellite restaurants. About 65% of the restaurant openings
occurred in the major markets in both 2007 and 2006.
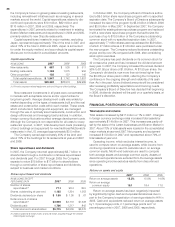
Systemwide restaurants at year end
(1)
2007 2006 2005
U.S. 13,862 13,774 13,727
Europe 6,480 6,403 6,352
APMEA 7,938 7,822 7,692
Other Countries & Corporate 3,097 3,047 2,995
Total 31,377 31,046 30,766
(1) Includes satellite units at December 31, 2007, 2006 and 2005 as follows: U.S.–
1,233, 1,254, 1,268; Europe–214, 201, 190; APMEA (primarily Japan) 1,454, 1,640,
1,730; Other Countries & Corporate–439, 417, 403.
In 2008, the Company expects to open about 950 traditional
restaurants and 50 satellite restaurants (of which the U.S., China
and six other consolidated markets are expected to open more
than 550 restaurants) and close about 250 traditional restaurants
and 150 satellite restaurants.
Approximately 65% of Company-operated restaurants and
about 80% of franchised and affi liated restaurants were located
in the major markets at the end of 2007. Franchisees and affi liates
operated 78% of the restaurants at year-end 2007.
Capital expenditures increased $205 million or 12% in
2007 and $135 million or 8% in 2006. The increase in capital
expenditures in 2007 was primarily due to increased investment
in new restaurants, primarily in Europe and the U.S., and the
impact of foreign currency translation. The increase in 2006 was
primarily due to increased investment in existing restaurants,
primarily in the U.S. Capital expenditures in both years refl ected
37