McDonalds 2007 Annual Report Download - page 35
Download and view the complete annual report
Please find page 35 of the 2007 McDonalds annual report below. You can navigate through the pages in the report by either clicking on the pages listed below, or by using the keyword search tool below to find specific information within the annual report.-
 1
1 -
2
-
3
-
4
-
5
-
6
-
7
-
8
-
9
-
10
-
11
-
12
-
13
-
14
-
15
-
16
-
17
-
18
-
19
-
20
-
21
-
22
-
23
-
24
-
 25
25 -
 26
26 -
 27
27 -
 28
28 -
 29
29 -
 30
30 -
 31
31 -
 32
32 -
 33
33 -
 34
34 -
 35
35 -
 36
36 -
 37
37 -
 38
38 -
 39
39 -
 40
40 -
 41
41 -
 42
42 -
 43
43 -
 44
44 -
 45
45 -
46
-
47
-
48
-
49
-
50
-
51
-
52
-
53
-
54
-
55
-
56
-
57
-
58
-
59
-
60
-
61
-
62
-
63
-
64
-
65
-
66
-
67
-
68
 |
 |

U.S. Europe
DOLLARS IN MILLIONS
2007 2006 2005 2007 2006 2005
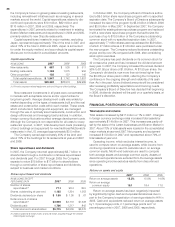
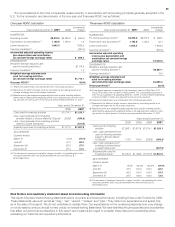
As reported
Number of Company-operated
restaurants at year end 2,090 2,104 2,097 2,177 2,253 2,382
Sales by Company-operated
restaurants $4,682 $4,410 $4,098 $6,817 $5,885 $5,465
Company-operated margin $ 876 $ 843 $ 768 $1,205 $ 960 $ 817
Store operating margin
Company-operated margin $ 876 $ 843 $ 768 $1,205 $ 960 $ 817
Plus:
Outside rent expense
(1)
82 82 79 248 229 225
Depreciation – buildings &
leasehold improvements
(1)
78 74 68 107 98 97
Less:
Rent & royalties
(2)
(691) (651) (605) (1,294) (1,099) (1,048)
Store operating margin $ 345 $ 348 $ 310 $ 266 $ 188 $ 91
Brand/real estate margin
Rent & royalties
(2)
$ 691 $ 651 $ 605 $1,294 $1,099 $1,048
Less:
Outside rent expense
(1)
(82) (82) (79) (248) (229) (225)
Depreciation – buildings &
leasehold improvements
(1)
(78) (74) (68) (107) (98) (97)
Brand/real estate margin $ 531 $ 495 $ 458 $ 939 $ 772 $ 726
(1) Represents certain costs recorded as occupancy & other operating expenses in the Consolidated statement of income – rent payable by McDonald’s to third parties on leased
sites and depreciation for buildings and leasehold improvements. This adjustment made to refl ect these occupancy costs in Brand/real estate margin. The relative percentage
of sites that are owned versus leased varies by country.
(2) Refl ects average Company–operated rent and royalties (as a percentage of 2007 sales: U.S. – 14.8% and Europe – 19.0%). This adjustment made to refl ect charge in Store
operating margin and income in Brand/real estate margin. Countries within Europe have varying economic profi les and a wide range of rent and royalties as a percentage
of sales.
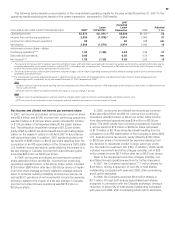
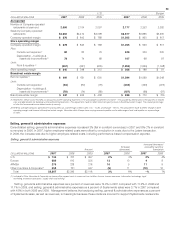
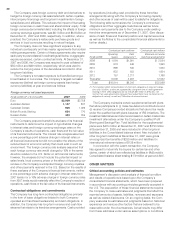
Selling, general & administrative expenses
Consolidated selling, general & administrative expenses increased 3% (fl at in constant currencies) in 2007 and 8% (7% in constant
currencies) in 2006. In 2007, higher employee-related costs were offset by a reduction in costs due to the Latam transaction.
In 2006, the increase was due to higher employee-related costs, including performance-based compensation expense.
Selling, general & administrative expenses
DOLLARS IN MILLIONS
2007 2006 2005 2007 2006
2007 2006
U.S. $ 744 $ 727 $ 697 2% 4% 2% 4%
Europe 689 610 556 13 10 4 8
APMEA 276 238 218 16 9 11 9
Other Countries & Corporate
(1)
658 721 647 (9) 11 (10) 10
Total $2,367 $2,296 $2,118 3% 8% –% 7%
(1) Included in Other Countries & Corporate are home offi ce support costs in areas such as facilities, fi nance, human resources, information technology, legal,
marketing, restaurant operations, supply chain and training.
Selling, general & administrative expenses as a percent of revenues were 10.4% in 2007 compared with 11.0% in 2006 and
11.1% in 2005, and selling, general & administrative expenses as a percent of Systemwide sales were 3.7% in 2007 compared
with 4.0% in both 2006 and 2005. Management believes that analyzing selling, general & administrative expenses as a percent
of Systemwide sales, as well as revenues, is meaningful because these costs are incurred to support Systemwide restaurants.
Amount
Increase/
(decrease)
Increase/(decrease)
excluding currency
translation
33