Toyota 2005 Annual Report Download - page 112
Download and view the complete annual report
Please find page 112 of the 2005 Toyota annual report below. You can navigate through the pages in the report by either clicking on the pages listed below, or by using the keyword search tool below to find specific information within the annual report.-
 1
1 -
2
-
3
-
4
-
5
-
6
-
7
-
8
-
9
-
10
-
11
-
12
-
13
-
14
-
15
-
16
-
17
-
18
-
19
-
20
-
21
-
22
-
23
-
24
-
25
-
26
-
27
-
28
-
29
-
30
-
31
-
32
-
33
-
34
-
35
-
36
-
37
-
38
-
39
-
40
-
41
-
42
-
43
-
44
-
45
-
46
-
47
-
48
-
49
-
50
-
51
-
52
-
53
-
54
-
55
-
56
-
57
-
58
-
59
-
60
-
61
-
62
-
63
-
64
-
65
-
66
-
67
-
68
-
69
-
70
-
71
-
72
-
73
-
74
-
75
-
76
-
77
-
78
-
79
-
80
-
81
-
82
-
83
-
84
-
85
-
86
-
87
-
88
-
89
-
90
-
91
-
92
-
93
-
94
-
95
-
96
-
97
-
98
-
99
-
100
-
101
-
 102
102 -
 103
103 -
 104
104 -
 105
105 -
 106
106 -
 107
107 -
 108
108 -
 109
109 -
 110
110 -
 111
111 -
 112
112 -
 113
113 -
 114
114 -
 115
115 -
 116
116 -
 117
117 -
 118
118 -
 119
119 -
 120
120 -
 121
121 -
 122
122 -
123
-
124
-
125
-
126
-
127
-
128
-
129
-
130
-
131
-
132
-
133
-
134
-
135
-
136
-
137
-
138
 |
 |
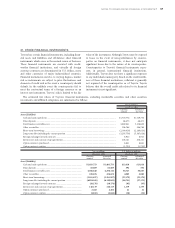
110 >NOTES TO CONSOLIDATED FINANCIAL STATEMENTS
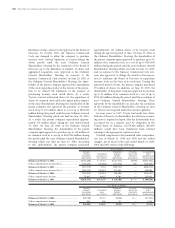
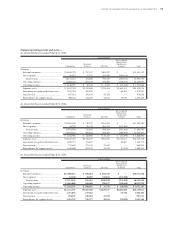
Following are explanatory notes regarding the financial
assets and liabilities other than derivative financial
instruments.
Cash and cash equivalents, time deposits and other
receivables—
In the normal course of business, substantially all cash and
cash equivalents, time deposits and other receivables are
highly liquid and are carried at amounts which approxi-
mate fair value.
Finance receivables, net—
The carrying value of variable rate finance receivables was
assumed to approximate fair value as they were repriced at
prevailing market rates at March 31, 2004 and 2005. The
fair value of fixed rate finance receivables was estimated by
discounting expected cash flows using the rates at which
loans of similar credit quality and maturity would be
made as of March 31, 2004 and 2005.
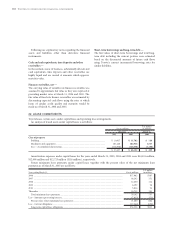
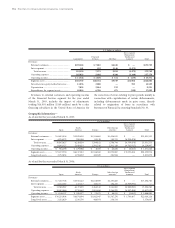
Short-term borrowings and long-term debt—
The fair values of short-term borrowings and total long-
term debt including the current portion were estimated
based on the discounted amounts of future cash flows
using Toyota’s current incremental borrowing rates for
similar liabilities.
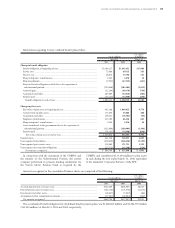
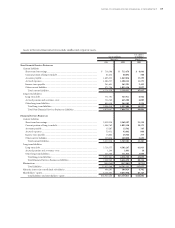
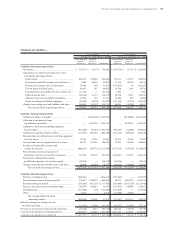
22. LEASE COMMITMENTS
Toyota leases certain assets under capital lease and operating lease arrangements.
An analysis of leased assets under capital leases is as follows:
U.S. dollars
Yen in millions in millions
March 31, March 31,
2004 2005 2005
Class of property
Building........................................................................................................................¥ 10,937 ¥ 11,762 $ 110
Machinery and equipment ......................................................................................... 161,446 162,938 1,517
Less—Accumulated depreciation.............................................................................. (118,956) (128,578) (1,198)
¥ 53,427 ¥ 46,122 $ 429
Amortization expenses under capital leases for the years ended March 31, 2003, 2004 and 2005 were ¥14,501 million,
¥12,908 million and ¥12,725 million ($118 million), respectively.
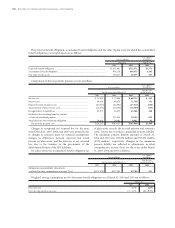
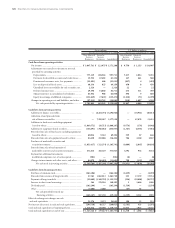
Future minimum lease payments under capital leases together with the present value of the net minimum lease
payments as of March 31, 2005 are as follows:
U.S. dollars
Years ending March 31, Yen in millions in millions
2006 ................................................................................................................................................................ ¥17,982 $167
2007 ................................................................................................................................................................ 16,202 151
2008 ................................................................................................................................................................ 12,200 114
2009 ................................................................................................................................................................ 6,192 58
2010 ................................................................................................................................................................ 5,814 54
Thereafter........................................................................................................................................................ 20,712 193
Total minimum lease payments ................................................................................................................ 79,102 737
Less - Amount representing interest.............................................................................................................. (7,822) (73)
Present value of net minimum lease payments ........................................................................................ 71,280 664
Less - Current obligations .............................................................................................................................. (17,044) (159)
Long-term capital lease obligations........................................................................................................... ¥54,236 $505