Toyota 2005 Annual Report Download - page 78
Download and view the complete annual report
Please find page 78 of the 2005 Toyota annual report below. You can navigate through the pages in the report by either clicking on the pages listed below, or by using the keyword search tool below to find specific information within the annual report.-
 1
1 -
2
-
3
-
4
-
5
-
6
-
7
-
8
-
9
-
10
-
11
-
12
-
13
-
14
-
15
-
16
-
17
-
18
-
19
-
20
-
21
-
22
-
23
-
24
-
25
-
26
-
27
-
28
-
29
-
30
-
31
-
32
-
33
-
34
-
35
-
36
-
37
-
38
-
39
-
40
-
41
-
42
-
43
-
44
-
45
-
46
-
47
-
48
-
49
-
50
-
51
-
52
-
53
-
54
-
55
-
56
-
57
-
58
-
59
-
60
-
61
-
62
-
63
-
64
-
65
-
66
-
67
-
 68
68 -
 69
69 -
 70
70 -
 71
71 -
 72
72 -
 73
73 -
 74
74 -
 75
75 -
 76
76 -
 77
77 -
 78
78 -
 79
79 -
 80
80 -
 81
81 -
 82
82 -
 83
83 -
 84
84 -
 85
85 -
 86
86 -
 87
87 -
 88
88 -
89
-
90
-
91
-
92
-
93
-
94
-
95
-
96
-
97
-
98
-
99
-
100
-
101
-
102
-
103
-
104
-
105
-
106
-
107
-
108
-
109
-
110
-
111
-
112
-
113
-
114
-
115
-
116
-
117
-
118
-
119
-
120
-
121
-
122
-
123
-
124
-
125
-
126
-
127
-
128
-
129
-
130
-
131
-
132
-
133
-
134
-
135
-
136
-
137
-
138
 |
 |

76
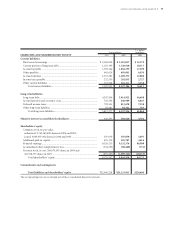
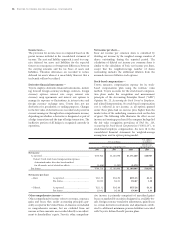
CONSOLIDATED BALANCE SHEETS
Toyota Motor Corporation
March 31, 2004 and 2005
U.S. dollars
Yen in millions in millions
ASSETS 2004 2005 2005
Current assets
Cash and cash equivalents ........................................................................... ¥ 1,729,776 ¥ 1,483,753 $ 13,816
Time deposits ............................................................................................... 68,473 63,609 592
Marketable securities.................................................................................... 448,457 543,124 5,058
Trade accounts and notes receivable, less allowance for
doubtful accounts of ¥28,966 million in 2004
and ¥18,656 million ($174 million) in 2005 ............................................. 1,531,651 1,616,341 15,051
Finance receivables, net................................................................................ 2,622,939 3,010,135 28,030
Other receivables .......................................................................................... 396,788 438,676 4,085
Inventories .................................................................................................... 1,083,326 1,306,709 12,168
Deferred income taxes ................................................................................. 457,161 475,764 4,430
Prepaid expenses and other current assets.................................................. 509,882 501,994 4,675
Total current assets............................................................................... 8,848,453 9,440,105 87,905
Noncurrent finance receivables, net.............................................................. 3,228,973 3,976,941 37,033
Investments and other assets
Marketable securities and other securities investments ............................. 2,241,971 2,704,142 25,181
Affiliated companies..................................................................................... 1,370,171 1,570,185 14,621
Employees receivables.................................................................................. 35,857 49,538 461
Other ............................................................................................................. 960,156 798,506 7,435
Total investments and other assets...................................................... 4,608,155 5,122,371 47,698
Property, plant and equipment
Land .............................................................................................................. 1,135,665 1,182,768 11,014
Buildings ....................................................................................................... 2,801,993 2,935,274 27,333
Machinery and equipment........................................................................... 7,693,616 7,897,509 73,540
Vehicles and equipment on operating leases .............................................. 1,493,780 1,828,697 17,029
Construction in progress ............................................................................. 237,195 214,781 2,000
13,362,249 14,059,029 130,916
Less—Accumulated depreciation................................................................ (8,007,602) (8,263,435) (76,948)
Property, plant and equipment, net .................................................... 5,354,647 5,795,594 53,968
Total assets ........................................................................................... ¥22,040,228 ¥24,335,011 $226,604
The accompanying notes are an integral part of these consolidated financial statements.