Toyota 2005 Annual Report Download - page 82
Download and view the complete annual report
Please find page 82 of the 2005 Toyota annual report below. You can navigate through the pages in the report by either clicking on the pages listed below, or by using the keyword search tool below to find specific information within the annual report.-
 1
1 -
2
-
3
-
4
-
5
-
6
-
7
-
8
-
9
-
10
-
11
-
12
-
13
-
14
-
15
-
16
-
17
-
18
-
19
-
20
-
21
-
22
-
23
-
24
-
25
-
26
-
27
-
28
-
29
-
30
-
31
-
32
-
33
-
34
-
35
-
36
-
37
-
38
-
39
-
40
-
41
-
42
-
43
-
44
-
45
-
46
-
47
-
48
-
49
-
50
-
51
-
52
-
53
-
54
-
55
-
56
-
57
-
58
-
59
-
60
-
61
-
62
-
63
-
64
-
65
-
66
-
67
-
68
-
69
-
70
-
71
-
 72
72 -
 73
73 -
 74
74 -
 75
75 -
 76
76 -
 77
77 -
 78
78 -
 79
79 -
 80
80 -
 81
81 -
 82
82 -
 83
83 -
 84
84 -
 85
85 -
 86
86 -
 87
87 -
 88
88 -
 89
89 -
 90
90 -
 91
91 -
 92
92 -
93
-
94
-
95
-
96
-
97
-
98
-
99
-
100
-
101
-
102
-
103
-
104
-
105
-
106
-
107
-
108
-
109
-
110
-
111
-
112
-
113
-
114
-
115
-
116
-
117
-
118
-
119
-
120
-
121
-
122
-
123
-
124
-
125
-
126
-
127
-
128
-
129
-
130
-
131
-
132
-
133
-
134
-
135
-
136
-
137
-
138
 |
 |
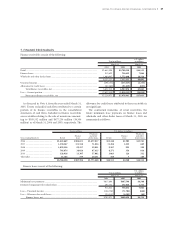
80
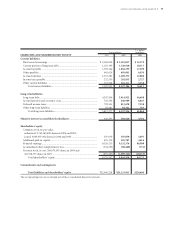
CONSOLIDATED STATEMENTS OF CASH FLOWS
Toyota Motor Corporation
For the years ended March 31, 2003, 2004 and 2005
U.S. dollars
Yen in millions in millions
2003 2004 2005 2005
Cash flows from operating activities
Net income..................................................................................... ¥ 750,942 ¥ 1,162,098 ¥ 1,171,260 $ 10,907
Adjustments to reconcile net income to net cash
provided by operating activities
Depreciation .............................................................................. 870,636 969,904 997,713 9,291
Provision for doubtful accounts and credit losses................... 99,837 83,138 63,154 588
Pension and severance costs, less payments ............................ 55,637 (159,267) (52,933) (493)
Losses on disposal of fixed assets.............................................. 46,492 39,742 49,159 458
Unrealized losses on available-for-sale securities, net............. 111,346 3,063 2,324 22
Deferred income taxes .............................................................. (74,273) 120,828 84,711 789
Minority interest in consolidated subsidiaries......................... 11,531 42,686 64,938 605
Equity in earnings of affiliated companies............................... (52,835) (120,295) (139,471) (1,299)
Changes in operating assets and liabilities, and other
Increase in accounts and notes receivable ........................... (191,027) (90,721) (178,363) (1,661)
Increase in inventories.......................................................... (38,043) (53,609) (191,545) (1,784)
(Increase) decrease in other current assets.......................... (58,036) 43,445 34,674 323
Increase in accounts payable ................................................ 116,946 159,120 153,747 1,432
Increase (decrease) in accrued income taxes....................... (27,340) (66,006) 41,228 384
Increase in other current liabilities ...................................... 181,595 203,535 190,450 1,773
Other...................................................................................... 136,680 (150,927) 79,894 743
Net cash provided by operating activities ....................... 1,940,088 2,186,734 2,370,940 22,078
Cash flows from investing activities
Additions to finance receivables ................................................... (3,439,936) (4,547,068) (4,296,966) (40,013)
Collection of finance receivables................................................... 2,356,380 3,152,302 3,311,974 30,841
Proceeds from sale of finance receivables..................................... 572,771 243,128 65,536 610
Additions to fixed assets excluding equipment
leased to others leased to others................................................. (1,005,931) (945,803) (1,068,287) (9,948)
Additions to equipment leased to others...................................... (604,298) (542,738) (854,953) (7,961)
Proceeds from sales of fixed assets excluding equipment
leased to others............................................................................ 61,847 73,925 69,396 646
Proceeds from sales of equipment leased to others ..................... 286,538 288,681 316,456 2,947
Purchases of marketable securities
and security investments ............................................................ (1,113,998) (1,336,467) (1,165,791) (10,856)
Proceeds from sales of marketable securities
and security investments ............................................................. 197,985 183,808 121,369 1,130
Proceeds upon maturity of marketable securities
and security investments ............................................................. 723,980 1,252,334 452,574 4,214
Payment for additional investments in affiliated companies,
net of cash acquired .................................................................... (28,229) (20,656) (901) (8)
Changes in investments and other assets, and other ................... (8,557) (17,941) (11,603) (107)
Net cash used in investing activities..................................... (2,001,448) (2,216,495) (3,061,196) (28,505)
Cash flows from financing activities
Purchase of common stock ........................................................... (454,611) (357,457) (264,106) (2,459)
Proceeds from issuance of long-term debt................................... 1,686,564 1,636,570 1,863,710 17,354
Payments of long-term debt.......................................................... (1,117,803) (1,253,045) (1,155,223) (10,757)
Increase in short-term borrowings ............................................... 30,327 353,833 140,302 1,306
Dividends paid............................................................................... (110,876) (137,678) (165,299) (1,539)
Other .............................................................................................. 4,074 — — —
Net cash provided by financing activities............................ 37,675 242,223 419,384 3,905
Effect of exchange rate changes on cash and cash equivalents ..... (41,447) (74,714) 24,849 231
Net increase (decrease) in cash and cash equivalents.................... (65,132) 137,748 (246,023) (2,291)
Cash and cash equivalents at beginning of year............................. 1,657,160 1,592,028 1,729,776 16,107
Cash and cash equivalents at end of year........................................ ¥ 1,592,028 ¥ 1,729,776 ¥ 1,483,753 $ 13,816
The accompanying notes are an integral part of these consolidated financial statements.