Toyota 2005 Annual Report Download - page 4
Download and view the complete annual report
Please find page 4 of the 2005 Toyota annual report below. You can navigate through the pages in the report by either clicking on the pages listed below, or by using the keyword search tool below to find specific information within the annual report.-
 1
1 -
 2
2 -
 3
3 -
 4
4 -
 5
5 -
 6
6 -
 7
7 -
 8
8 -
 9
9 -
 10
10 -
 11
11 -
 12
12 -
 13
13 -
 14
14 -
 15
15 -
16
-
17
-
18
-
19
-
20
-
21
-
22
-
23
-
24
-
25
-
26
-
27
-
28
-
29
-
30
-
31
-
32
-
33
-
34
-
35
-
36
-
37
-
38
-
39
-
40
-
41
-
42
-
43
-
44
-
45
-
46
-
47
-
48
-
49
-
50
-
51
-
52
-
53
-
54
-
55
-
56
-
57
-
58
-
59
-
60
-
61
-
62
-
63
-
64
-
65
-
66
-
67
-
68
-
69
-
70
-
71
-
72
-
73
-
74
-
75
-
76
-
77
-
78
-
79
-
80
-
81
-
82
-
83
-
84
-
85
-
86
-
87
-
88
-
89
-
90
-
91
-
92
-
93
-
94
-
95
-
96
-
97
-
98
-
99
-
100
-
101
-
102
-
103
-
104
-
105
-
106
-
107
-
108
-
109
-
110
-
111
-
112
-
113
-
114
-
115
-
116
-
117
-
118
-
119
-
120
-
121
-
122
-
123
-
124
-
125
-
126
-
127
-
128
-
129
-
130
-
131
-
132
-
133
-
134
-
135
-
136
-
137
-
138
 |
 |

2
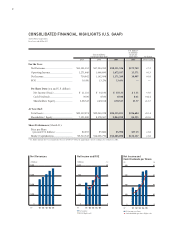
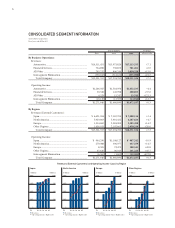
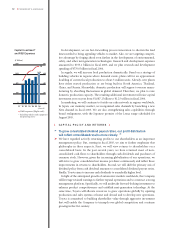
CONSOLIDATED FINANCIAL HIGHLIGHTS (U.S. GAAP)
Toyota Motor Corporation
Fiscal years ended March 31
10,000
5,000
15,000
20,000
’01 ’02 ’03 ’04 ’05
0
FY
Net Revenues
(¥ Billion)
600 10
300 5
900 15
1,200 20
’01 ’02 ’03 ’04 ’05
00
FY
Net Income and ROE
(¥ Billion) (%)
Net income
ROE (Right scale)
200 40
100 20
300 60
400 80
’01 ’02 ’03 ’04 ’05
00
FY
Net Income and
Cash Dividends per Share
(¥) (¥)
Net income per share
Cash dividends per share (Right scale)
U.S. dollars*
in millions
Yen in millions except per
except per share data share data % change
2003 2004 2005 2005 2004 vs 2005
For the Year:
Net Revenues............................................ ¥15,501,553 ¥17,294,760 ¥18,551,526 $172,749 +7.3
Operating Income.................................... 1,271,646 1,666,890 1,672,187 15,571 +0.3
Net Income............................................... 750,942 1,162,098 1,171,260 10,907 +0.8
ROE .......................................................... 10.4% 15.2% 13.6% — —
Per Share Data (yen and U.S. dollars):
Net Income (Basic) .............................. ¥ 211.32 ¥ 342.90 ¥ 355.35 $ 3.31 +3.6
Cash Dividends .................................... 36.00 45.00 65.00 0.61 +44.4
Shareholders’ Equity............................ 2,063.43 2,456.08 2,767.67 25.77 +12.7
At Year-End:
Total Assets .............................................. ¥20,152,974 ¥22,040,228 ¥24,335,011 $226,604 +10.4
Shareholders’ Equity................................ 7,121,000 8,178,567 9,044,950 84,225 +10.6
Share Performance (March 31):
Price per Share
(yen and U.S. dollars): ........................... ¥2,635 ¥3,880 ¥3,990 $37.15 +2.8
Market Capitalization.............................. ¥9,512,343 ¥14,006,790 ¥14,403,890 $134,127 +2.8
* U.S. dollar amounts have been translated at the rate of ¥107.39=US$1, the approximate current exchange rate at March 31, 2005.