Toyota 2005 Annual Report Download - page 35
Download and view the complete annual report
Please find page 35 of the 2005 Toyota annual report below. You can navigate through the pages in the report by either clicking on the pages listed below, or by using the keyword search tool below to find specific information within the annual report.-
 1
1 -
2
-
3
-
4
-
5
-
6
-
7
-
8
-
9
-
10
-
11
-
12
-
13
-
14
-
15
-
16
-
17
-
18
-
19
-
20
-
21
-
22
-
23
-
24
-
 25
25 -
 26
26 -
 27
27 -
 28
28 -
 29
29 -
 30
30 -
 31
31 -
 32
32 -
 33
33 -
 34
34 -
 35
35 -
 36
36 -
 37
37 -
 38
38 -
 39
39 -
 40
40 -
 41
41 -
 42
42 -
 43
43 -
 44
44 -
 45
45 -
46
-
47
-
48
-
49
-
50
-
51
-
52
-
53
-
54
-
55
-
56
-
57
-
58
-
59
-
60
-
61
-
62
-
63
-
64
-
65
-
66
-
67
-
68
-
69
-
70
-
71
-
72
-
73
-
74
-
75
-
76
-
77
-
78
-
79
-
80
-
81
-
82
-
83
-
84
-
85
-
86
-
87
-
88
-
89
-
90
-
91
-
92
-
93
-
94
-
95
-
96
-
97
-
98
-
99
-
100
-
101
-
102
-
103
-
104
-
105
-
106
-
107
-
108
-
109
-
110
-
111
-
112
-
113
-
114
-
115
-
116
-
117
-
118
-
119
-
120
-
121
-
122
-
123
-
124
-
125
-
126
-
127
-
128
-
129
-
130
-
131
-
132
-
133
-
134
-
135
-
136
-
137
-
138
 |
 |
COST REDUCTION ACTIVITIES >33
including design, production engi-
neering, and purchasing. By signif-
icantly improving efficiency and
lowering costs, that dynamic, multi-
faceted cooperation is a driver of our
products’ growing competitiveness.
Toyota pursues its cost reduc-
tion efforts based on long-term
relationships of mutual trust with
suppliers. We work toward challeng-
ing targets as partners. And, the
improvements gained through
those initiatives strengthen the cor-
porate organizations and market
competitiveness of Toyota and its
suppliers.
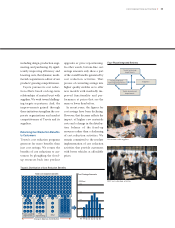
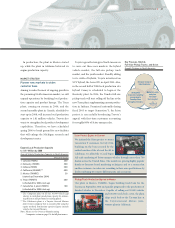
Returning Cost Reduction Benefits
to Customers
Toyota’s cost reduction programs
generate far more benefits than
just cost savings. We return the
benefits of cost reductions to cus-
tomers by ploughing the freed-
up resources back into product
upgrades or price repositioning.
In other words, bottom-line cost
savings amounts only show a part
of the overall benefits generated by
cost reduction activities. That
process of converting savings into
higher quality enables us to offer
new models with markedly im-
proved functionality and per-
formance at prices that are the
same or lower than before.
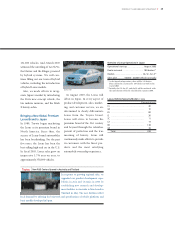
In recent years, the figures for
cost savings have been declining.
However, that decrease reflects the
impact of higher raw materials
costs and a change in the distribu-
tion balance of the freed-up
resources rather than a slackening
of cost reduction activities. We
remain committed to the resolute
implementation of cost reduction
activities that provide customers
with better vehicles at affordable
prices.
Total cost reduction benefits Cost Savings Amounts
Change in balance of distribution
Cost savings
Product capability
improvements
Price
repositioning Other
300
200
100
400
’01’99 ’02 ’03 ’05’04
0
FY
(¥ Billion)
’00
Toyota’s Distribution of Cost Reduction Benefits
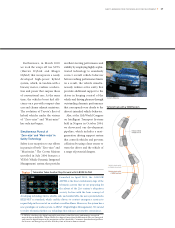
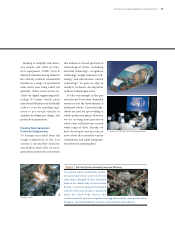
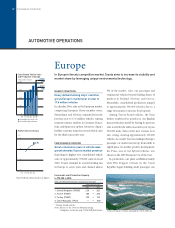
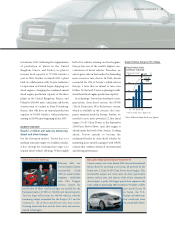
Discussions with suppliers
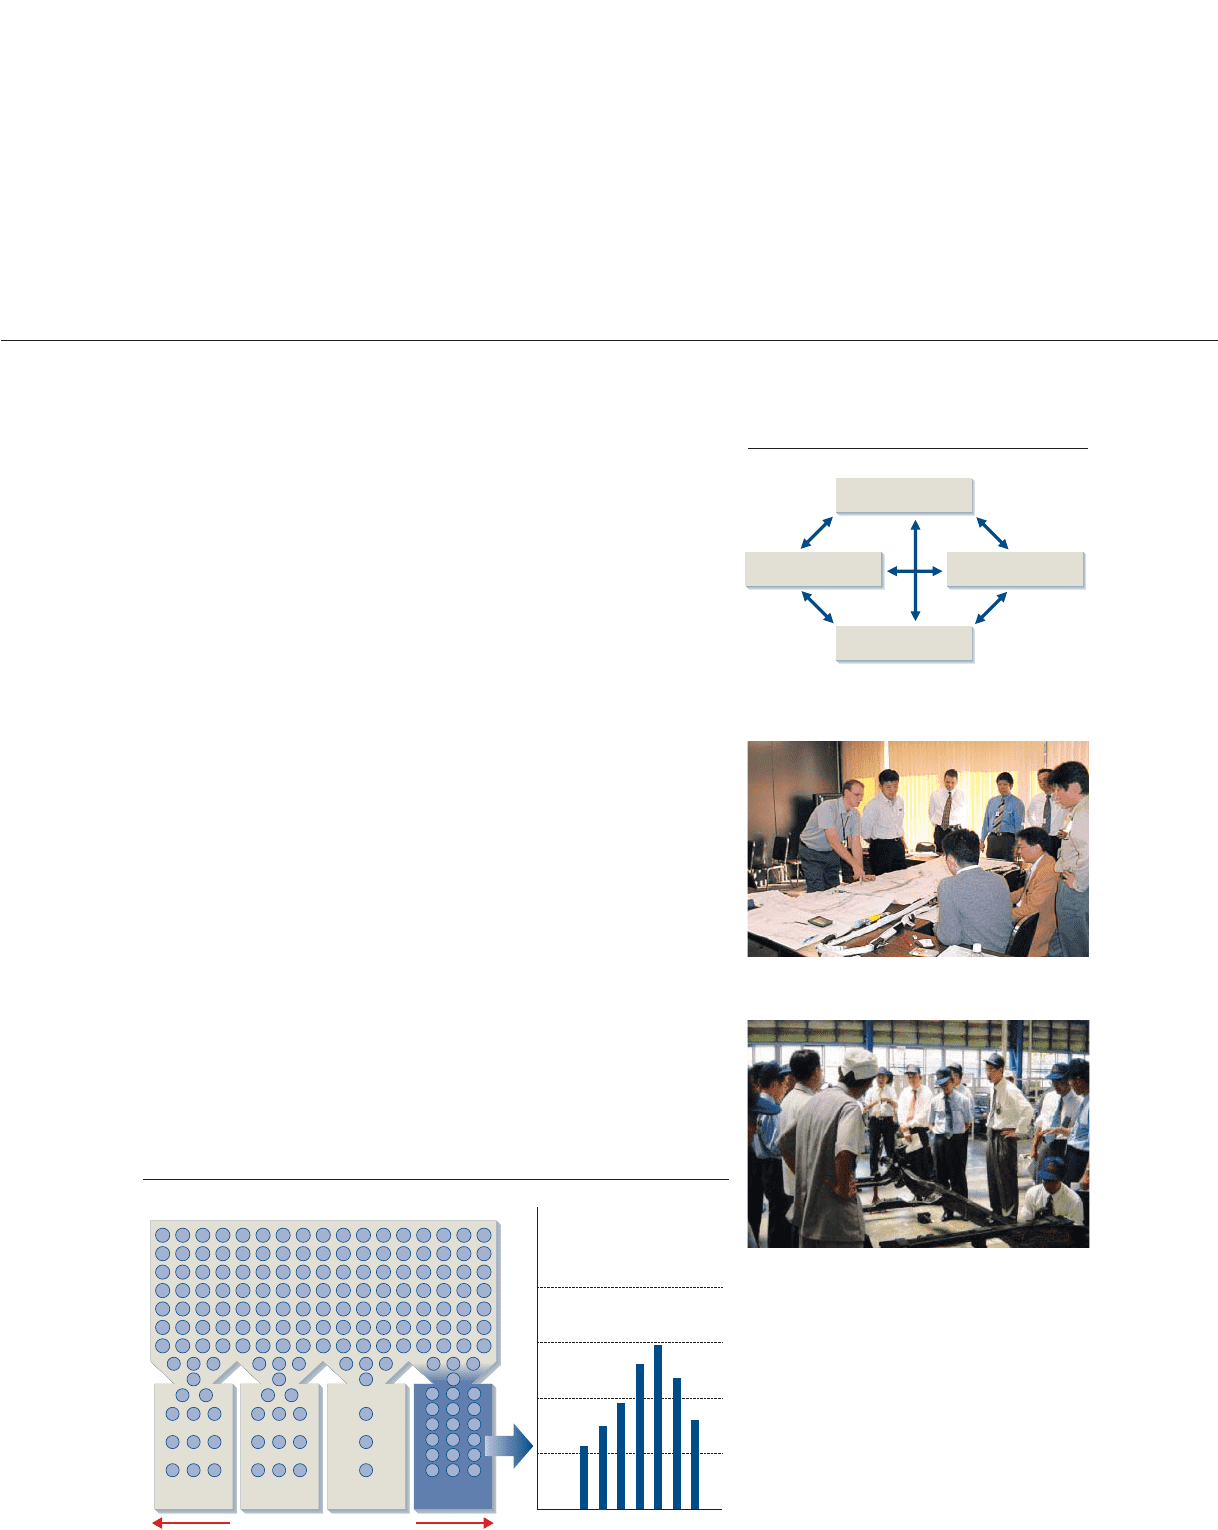
IMV cost reduction activities
株主
Toyota technology
departments
株主
Toyota procurement
departments
株主
Suppliers
株主
Toy ota production
technology departments
Four-Phase Integrated Reforms