Toyota 2005 Annual Report Download - page 59
Download and view the complete annual report
Please find page 59 of the 2005 Toyota annual report below. You can navigate through the pages in the report by either clicking on the pages listed below, or by using the keyword search tool below to find specific information within the annual report.-
 1
1 -
2
-
3
-
4
-
5
-
6
-
7
-
8
-
9
-
10
-
11
-
12
-
13
-
14
-
15
-
16
-
17
-
18
-
19
-
20
-
21
-
22
-
23
-
24
-
25
-
26
-
27
-
28
-
29
-
30
-
31
-
32
-
33
-
34
-
35
-
36
-
37
-
38
-
39
-
40
-
41
-
42
-
43
-
44
-
45
-
46
-
47
-
48
-
 49
49 -
 50
50 -
 51
51 -
 52
52 -
 53
53 -
 54
54 -
 55
55 -
 56
56 -
 57
57 -
 58
58 -
 59
59 -
 60
60 -
 61
61 -
 62
62 -
 63
63 -
 64
64 -
 65
65 -
 66
66 -
 67
67 -
 68
68 -
 69
69 -
70
-
71
-
72
-
73
-
74
-
75
-
76
-
77
-
78
-
79
-
80
-
81
-
82
-
83
-
84
-
85
-
86
-
87
-
88
-
89
-
90
-
91
-
92
-
93
-
94
-
95
-
96
-
97
-
98
-
99
-
100
-
101
-
102
-
103
-
104
-
105
-
106
-
107
-
108
-
109
-
110
-
111
-
112
-
113
-
114
-
115
-
116
-
117
-
118
-
119
-
120
-
121
-
122
-
123
-
124
-
125
-
126
-
127
-
128
-
129
-
130
-
131
-
132
-
133
-
134
-
135
-
136
-
137
-
138
 |
 |

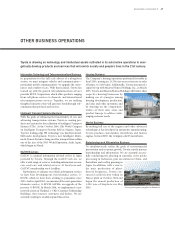
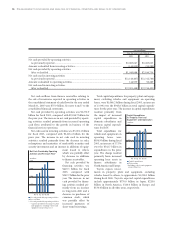
general and administrative
expenses (¥23.8 billion and
¥8.4 billion, respectively).
In addition, the govern-
ment subsidy representing
the difference between the
benefit obligations of the
substitutional portion and
the government-specified
portion of plan assets of
¥320.9 billion for fiscal
2004 and ¥121.5 billion for
fiscal 2005, respectively,
which were both trans-
ferred to the government,
reduced selling, general and
administrative expenses. The net impact of these items
was a reduction of operating expenses by ¥47.2 billion
during fiscal 2005, which increased by ¥59.8 billion
compared to a reduction of operating expenses by ¥107.0
billion during fiscal 2004. See note 19 to the consolidated
financial statements.
Continued cost reduction efforts reduced costs and
expenses in fiscal 2005 by approximately ¥160.0 billion
over what would have otherwise been incurred. These cost
reduction efforts relate to ongoing value engineering and
value analysis activities, the use of common parts that
result in a reduction of part types and other manu-
facturing initiatives designed to reduce the costs of vehicle
production.
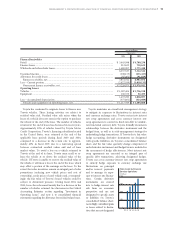
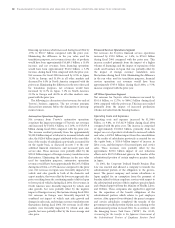
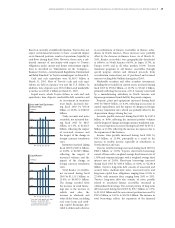
Cost of products sold increased by ¥993.9 billion, or
7.4%, to ¥14,500.2 billion during fiscal 2005 compared
with the prior year. This increase (before the elimination
of intersegment amounts) reflects an increase of ¥881.6
billion, or 6.8%, for the automotive operations and an
increase of ¥112.5 billion, or 14.8%, for the all other
operations segment. The increase in cost of products sold
for the automotive operations is primarily attributed to the
net impact of increased vehicle unit sales and changes in
sales mix, the impact of increased parts and service sales, and
the impact of the increase in research and development
expenses, which were partially offset by the impact of con-
tinued cost reduction efforts, the impact of decrease in the
settlement losses relating to the transfer to the government
of the substitutional portion and the impact of foreign
currency fluctuations during fiscal 2005. The increase in
cost of products sold for all other operations primarily
related to the increase in net revenues.
Cost of financing operations increased by ¥5.7 billion,
or 1.6%, to ¥369.8 billion during fiscal 2005 compared
with the prior year. The increase resulted primarily from
the impact of increased interest expenses caused primarily
by higher interest rates and
an increase in borrowings
attributed to business expan-
sion in the United States,
that was partially offset by
the impact of an increase
in net gains on derivative
financial instruments that
are not designated as hedges
and are marked-to-market
at the end of each period.
Selling, general and admin-
istrative expenses increas-
ed by ¥251.9 billion, or
14.3%, to ¥2,009.2 billion
during fiscal 2005 com-
pared with the prior year. This increase (before the elimina-
tion of intersegment amounts) reflects an increase of ¥324.5
billion, or 21.8%, for the automotive operations, a decrease of
¥20.9 billion, or 9.3%, for the financial services operations
and an increase of ¥3.0 billion, or 2.5%, for all other
operations segment. The increase for the automotive
operations consisted primarily of the impact from the
reduction of gains attributed to the transfer of the
substitutional portion of certain employee pension funds
to the government and the impact of increased expenses in
expanding business operations, which were partially offset
by the impact of unfavorable currency fluctuations. The
decrease for the financial services operations reflects lower
provisions for credit losses specifically in North America
due to an improvement in the delinquent loan collection
rate and the favorable impact of fluctuations in foreign
currency translation rates.
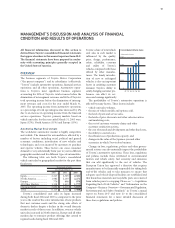
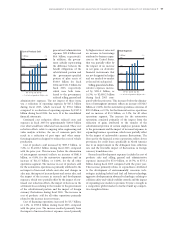
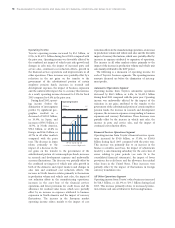
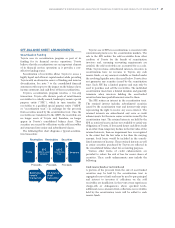
Research and development expenses (included in cost of
products sales and selling, general and administrative
expenses) increased by ¥72.9 billion, or 10.7%, to ¥755.1
billion during fiscal 2005 compared with the prior year.
This increase primarily relates to expenditures attributed
to the development of environmentally conscious tech-
nologies including hybrid and fuel cell battery technology,
aggressive developments in advanced technologies relating to
collision safety and vehicle stability controls and the impact
of expanding new models to promote Toyota’s strength in
a competitive global market to further build up competi-
tive strength in future.
MANAGEMENT’S DISCUSSION AND ANALYSIS OF FINANCIAL CONDITION AND RESULTS OF OPERATIONS >57
400
200
600
800
’01 ’02 ’03 ’04 ’05
0
R&D Expenses
FY
% of sales of products (Right scale)
(¥ Billion)
4
2
6
8
0
(%)
8,000
4,000
12,000
16,000
’01 ’02 ’03 ’04 ’05
0
FY
Cost of Products Sold
(¥ Billion)
% of sales of products (Right scale)
50
25
75
100
0
(%)