Toyota 2005 Annual Report Download - page 117
Download and view the complete annual report
Please find page 117 of the 2005 Toyota annual report below. You can navigate through the pages in the report by either clicking on the pages listed below, or by using the keyword search tool below to find specific information within the annual report.-
 1
1 -
2
-
3
-
4
-
5
-
6
-
7
-
8
-
9
-
10
-
11
-
12
-
13
-
14
-
15
-
16
-
17
-
18
-
19
-
20
-
21
-
22
-
23
-
24
-
25
-
26
-
27
-
28
-
29
-
30
-
31
-
32
-
33
-
34
-
35
-
36
-
37
-
38
-
39
-
40
-
41
-
42
-
43
-
44
-
45
-
46
-
47
-
48
-
49
-
50
-
51
-
52
-
53
-
54
-
55
-
56
-
57
-
58
-
59
-
60
-
61
-
62
-
63
-
64
-
65
-
66
-
67
-
68
-
69
-
70
-
71
-
72
-
73
-
74
-
75
-
76
-
77
-
78
-
79
-
80
-
81
-
82
-
83
-
84
-
85
-
86
-
87
-
88
-
89
-
90
-
91
-
92
-
93
-
94
-
95
-
96
-
97
-
98
-
99
-
100
-
101
-
102
-
103
-
104
-
105
-
106
-
 107
107 -
 108
108 -
 109
109 -
 110
110 -
 111
111 -
 112
112 -
 113
113 -
 114
114 -
 115
115 -
 116
116 -
 117
117 -
 118
118 -
 119
119 -
 120
120 -
 121
121 -
 122
122 -
 123
123 -
 124
124 -
 125
125 -
 126
126 -
 127
127 -
128
-
129
-
130
-
131
-
132
-
133
-
134
-
135
-
136
-
137
-
138
 |
 |

NOTES TO CONSOLIDATED FINANCIAL STATEMENTS >115
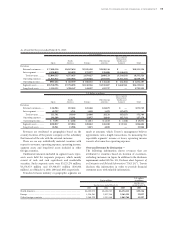
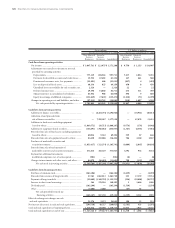
Revenues are attributed to geographies based on the
country location of the parent company or the subsidiary
that transacted the sale with the external customer.
There are no any individually material countries with
respect to revenues, operating expenses, operating income,
segment assets and long-lived assets included in other
foreign countries.
Unallocated amounts included in segment assets repre-
sents assets held for corporate purposes, which mainly
consist of cash and cash equivalents and marketable
securities. Such corporate assets were ¥3,125,276 million,
¥3,270,973 million and ¥3,308,055 million ($30,804
million), as of March 31, 2003, 2004 and 2005, respectively.
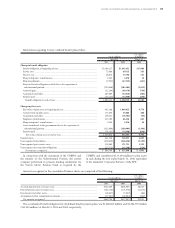
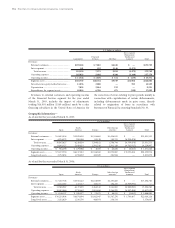
Transfers between industry or geographic segments are
made at amounts which Toyota’s management believes
approximate arm’s-length transactions. In measuring the
reportable segments’ income or losses, operating income
consists of revenue less operating expenses.
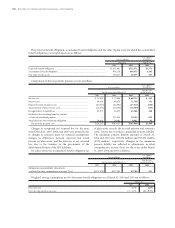
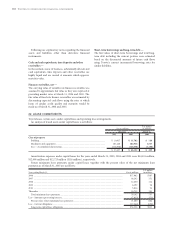
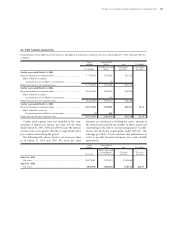
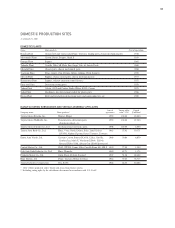
Overseas Revenues by destination—
The following information shows revenues that are
attributed to countries based on location of customers,
excluding customers in Japan. In addition to the disclosure
requirements under FAS No. 131, Disclosure about Segments of
an Enterprise and Related Information (“FAS 131”), Toyota
discloses this information in order to provide financial
statement users with valuable information.
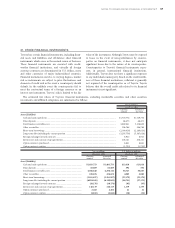
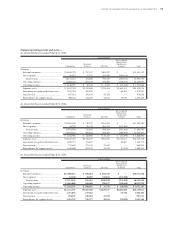
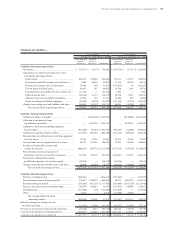
As of and for the year ended March 31, 2005:
Yen in millions
Inter-segment
Elimination/
North Other foreign Unallocated
Japan America Europe countries Amount Total
Revenues
External customers...... ¥ 7,408,136 ¥6,187,624 ¥2,305,450 ¥2,650,316 ¥ — ¥18,551,526
Inter-segment .............. 4,596,019 185,829 173,977 158,808 (5,114,633) —
Total revenue .......... 12,004,155 6,373,453 2,479,427 2,809,124 (5,114,633) 18,551,526
Operating expenses ..... 11,016,913 5,925,894 2,370,886 2,667,898 (5,102,252) 16,879,339
Operating income........ ¥987,242 ¥ 447,559 ¥ 108,541 ¥ 141,226 ¥ (12,381) ¥ 1,672,187
Segment assets ............. ¥10,740,796 ¥7,738,898 ¥2,242,566 ¥1,943,807 ¥ 1,668,944 ¥24,335,011
Long-lived assets.......... 3,110,123 1,708,147 544,597 432,727 — 5,795,594
U.S. dollars in millions
Inter-segment
Elimination/
North Other foreign Unallocated
Japan America Europe countries Amount Total
Revenues
External customers...... $ 68,984 $57,618 $21,468 $24,679 $ — $172,749
Inter-segment .............. 42,797 1,731 1,620 1,479 (47,627) —
Total revenue .......... 111,781 59,349 23,088 26,158 (47,627) 172,749
Operating expenses ..... 102,588 55,181 22,077 24,843 (47,511) 157,178
Operating income....... $ 9,193 $ 4,168 $ 1,011 $ 1,315 $ (116) $ 15,571
Segment assets ............. $100,017 $72,064 $20,882 $18,100 $ 15,541 $226,604
Long-lived assets.......... 28,961 15,906 5,071 4,030 — 53,968
U.S. dollars
Yen in millions in millions
For the year
For the years ended March 31, ended March 31,
2003 2004 2005 2005
North America.................................................................................. ¥6,200,075 ¥6,108,723 ¥6,374,235 $59,356
Europe .............................................................................................. 1,556,261 2,037,344 2,365,525 22,027
Other foreign countries.................................................................... 2,568,229 3,355,148 3,865,764 35,997