Toyota 2005 Annual Report Download - page 57
Download and view the complete annual report
Please find page 57 of the 2005 Toyota annual report below. You can navigate through the pages in the report by either clicking on the pages listed below, or by using the keyword search tool below to find specific information within the annual report.-
 1
1 -
2
-
3
-
4
-
5
-
6
-
7
-
8
-
9
-
10
-
11
-
12
-
13
-
14
-
15
-
16
-
17
-
18
-
19
-
20
-
21
-
22
-
23
-
24
-
25
-
26
-
27
-
28
-
29
-
30
-
31
-
32
-
33
-
34
-
35
-
36
-
37
-
38
-
39
-
40
-
41
-
42
-
43
-
44
-
45
-
46
-
 47
47 -
 48
48 -
 49
49 -
 50
50 -
 51
51 -
 52
52 -
 53
53 -
 54
54 -
 55
55 -
 56
56 -
 57
57 -
 58
58 -
 59
59 -
 60
60 -
 61
61 -
 62
62 -
 63
63 -
 64
64 -
 65
65 -
 66
66 -
 67
67 -
68
-
69
-
70
-
71
-
72
-
73
-
74
-
75
-
76
-
77
-
78
-
79
-
80
-
81
-
82
-
83
-
84
-
85
-
86
-
87
-
88
-
89
-
90
-
91
-
92
-
93
-
94
-
95
-
96
-
97
-
98
-
99
-
100
-
101
-
102
-
103
-
104
-
105
-
106
-
107
-
108
-
109
-
110
-
111
-
112
-
113
-
114
-
115
-
116
-
117
-
118
-
119
-
120
-
121
-
122
-
123
-
124
-
125
-
126
-
127
-
128
-
129
-
130
-
131
-
132
-
133
-
134
-
135
-
136
-
137
-
138
 |
 |
MANAGEMENT’S DISCUSSION AND ANALYSIS OF FINANCIAL CONDITION AND RESULTS OF OPERATIONS >55
Japanese yen against other currencies has the opposite effect.
The Japanese yen has on average been stronger against the
U.S. dollar during fiscal 2004 and 2005. At the end of fiscal
2004 and 2005, the Japanese yen was stronger and weaker,
respectively, against the U.S. dollar in comparison to the end
of the prior fiscal year. As compared to the euro, the
Japanese yen has on average been weaker during fiscal 2004
and 2005. At the end of fiscal 2004 and 2005, the Japanese
yen was stronger and weaker, respectively, against the euro
compared to the end of the prior fiscal year. See further
discussion in the Market Risk Disclosures section regarding
“Foreign Currency Exchange Rate Risk”.
During fiscal 2004 and 2005, the average value of the yen
fluctuated against the major currencies including the U.S.
dollar and euro compared with the average value of the
previous fiscal year, respectively, as noted above. The
operating results excluding the impact of currency
fluctuations described in the “Results of Operations—Fiscal
2005 Compared with Fiscal 2004” and the “Results of
Operations—Fiscal 2004 Compared with Fiscal 2003” show
results of net revenues obtained by applying the yen’s average
exchange rate in the previous fiscal year to the local currency-
denominated net revenues for fiscal 2004 and 2005,
respectively, as if the value of the yen had remained constant
for the comparable periods. Results excluding the impact of
currency fluctuations year-on-year are not on the same basis
as Toyota’s consolidated financial statements and do not
conform with U.S.GAAP. Furthermore, Toyota does not
believe that these measures are a substitute for U.S.GAAP
measures. However, Toyota believes that such results
excluding the impact of currency fluctuations year-on-year
provide additional useful information to investors regarding
the operating performance on a local currency basis.
Segmentation
Toyota’s most significant business segment is its automotive
operations. Toyota carries out its automotive operations as a
global competitor in the worldwide automotive market.
Toyota’s management allocates resources to, and assesses the
performance of, its automotive operations as a single business
segment on a worldwide basis. Toyota does not manage any
subset of its automotive operations, such as domestic or
overseas operations or parts, as separate management units.
The management of the automotive operations is aligned
on a functional basis with managers having oversight
responsibility for the major operating functions within the
segment. Management assesses financial and non-financial
data such as units of sale, units of production, market share
information, vehicle model plans and plant location costs to
allocate resources within the automotive operations.
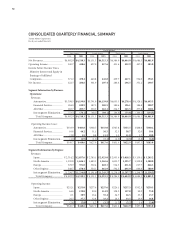
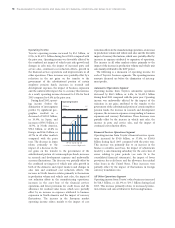
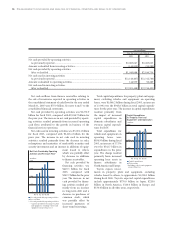
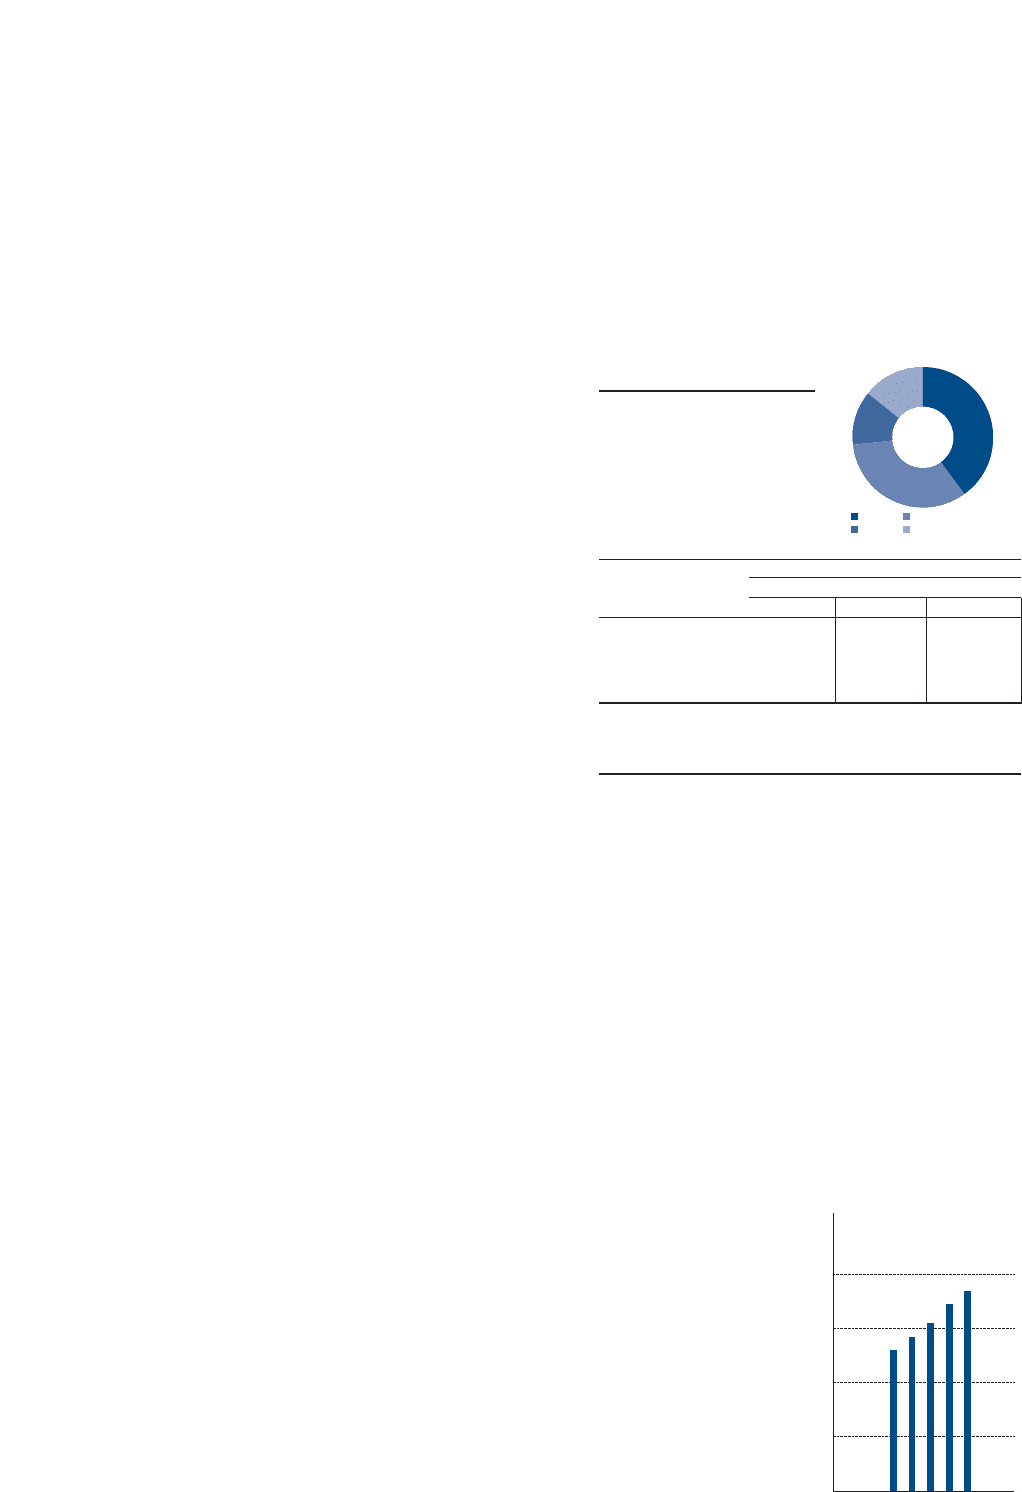
GEOGRAPHICAL
BREAKDOWN
The following table sets forth
Toyota’s net revenues from
external customers in each
geographical market for the
past three fiscal years.
Yen in millions
For the years ended March 31,
2003 2004 2005
Japan ........................ ¥6,621,054 ¥7,167,704 ¥7,408,136
North America ........ 5,929,803 5,910,422 6,187,624
Europe ..................... 1,514,683 2,018,969 2,305,450
All Other Markets ... 1,436,013 2,197,665 2,650,316
RESULTS OF OPERATIONS —
FISCAL 2005 COMPARED WITH FISCAL 2004
Net Revenues
Toyota had net revenues for fiscal 2005 of ¥18,551.5 billion,
an increase of ¥1,256.8 billion, or 7.3%, compared with the
prior year. This increase principally reflects the impact of
increased vehicle unit sales, increased parts and service sales
and increased financings. These increases were partially
offset by the impact of fluctuations in foreign currency
translation rates particularly against the U.S. dollar.
Eliminating the difference in the yen value used for transla-
tion purposes, net revenues would have been approximately
¥18,846.1 billion during fiscal 2005, a 9.0% increase com-
pared with the prior year. Toyota’s net revenues include net
revenues from sales of products which increased during
fiscal 2005 by 7.3% from the prior year to ¥17,790.8 billion
and net revenues from financing operations which increased
6.1% in fiscal 2005 compared with the prior year to ¥760.7
billion. Eliminating the difference in the yen value used for
translation purposes, net revenues from sales of products
would have been approxi-
mately ¥18,062.8 billion, a
9.0% increase, while net rev-
enues from financing opera-
tions would have increased
approximately 9.3% during
fiscal 2005 compared to the
prior year to ¥783.3 billion.
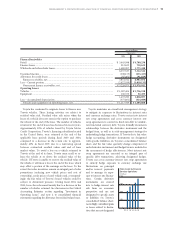
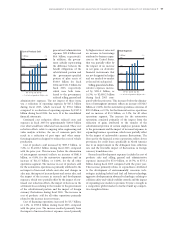
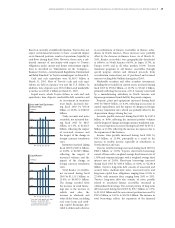
Geographically, net revenues
for fiscal 2005 increased by
3.4% in Japan, 4.7% in
North America, 14.2% in
Europe and 20.6% in all
other markets compared with
the prior year. Eliminating
the difference in the yen value
Japan North America
Europe All Other Markets
14.3%
12.4%
33.4%
39.9%
Revenues by Market
10,000
5,000
15,000
20,000
’01 ’02 ’03 ’04 ’05
0
FY
Net Revenues
(¥ Billion)