Toyota 2005 Annual Report Download - page 123
Download and view the complete annual report
Please find page 123 of the 2005 Toyota annual report below. You can navigate through the pages in the report by either clicking on the pages listed below, or by using the keyword search tool below to find specific information within the annual report.-
 1
1 -
2
-
3
-
4
-
5
-
6
-
7
-
8
-
9
-
10
-
11
-
12
-
13
-
14
-
15
-
16
-
17
-
18
-
19
-
20
-
21
-
22
-
23
-
24
-
25
-
26
-
27
-
28
-
29
-
30
-
31
-
32
-
33
-
34
-
35
-
36
-
37
-
38
-
39
-
40
-
41
-
42
-
43
-
44
-
45
-
46
-
47
-
48
-
49
-
50
-
51
-
52
-
53
-
54
-
55
-
56
-
57
-
58
-
59
-
60
-
61
-
62
-
63
-
64
-
65
-
66
-
67
-
68
-
69
-
70
-
71
-
72
-
73
-
74
-
75
-
76
-
77
-
78
-
79
-
80
-
81
-
82
-
83
-
84
-
85
-
86
-
87
-
88
-
89
-
90
-
91
-
92
-
93
-
94
-
95
-
96
-
97
-
98
-
99
-
100
-
101
-
102
-
103
-
104
-
105
-
106
-
107
-
108
-
109
-
110
-
111
-
112
-
 113
113 -
 114
114 -
 115
115 -
 116
116 -
 117
117 -
 118
118 -
 119
119 -
 120
120 -
 121
121 -
 122
122 -
 123
123 -
 124
124 -
 125
125 -
 126
126 -
 127
127 -
 128
128 -
 129
129 -
 130
130 -
 131
131 -
 132
132 -
 133
133 -
134
-
135
-
136
-
137
-
138
 |
 |

NOTES TO CONSOLIDATED FINANCIAL STATEMENTS >121
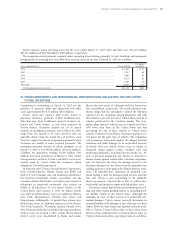
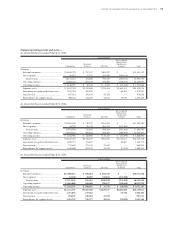
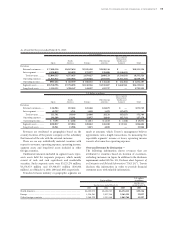
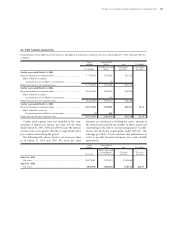
Reconciliations of the differences between basic and diluted net income per share for the years ended March 31, 2003, 2004 and 2005 are
as follows:
Yen in Thousands of
millions shares Yen U.S. dollars
Weighted-average Net income Net income
Net income shares per share per share
For the year ended March 31, 2003
Basic net income per common share............................................... ¥ 750,942 3,553,602 ¥211.32
Effect of diluted securities
Assumed exercise of dilutive stock options............................ 22
Diluted net income per common share........................................... ¥ 750,942 3,553,624 ¥211.32
For the year ended March 31, 2004
Basic net income per common share............................................... ¥1,162,098 3,389,074 ¥342.90
Effect of diluted securities
Assumed exercise of dilutive stock options............................ 303
Diluted net income per common share........................................... ¥1,162,098 3,389,377 ¥342.86
For the year ended March 31, 2005
Basic net income per common share............................................... ¥1,171,260 3,296,092 ¥355.35 $3.31
Effect of dilutive securities
Assumed exercise of dilutive stock options............................ (1) 662
Diluted net income per common share........................................... ¥1,171,259 3,296,754 ¥355.28 $3.31
25. PER SHARE AMOUNTS
Certain stock options were not included in the com-
putation of diluted net income per share for the years
ended March 31, 2003, 2004 and 2005 because the options’
exercise prices were greater than the average market price
per common share during the period.
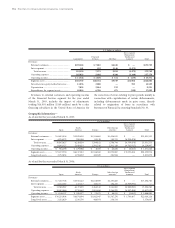
The following table shows Toyota’s net assets per share
as of March 31, 2004 and 2005. Net assets per share
amounts are calculated as dividing net assets’ amount at
the end of each period by the number of shares issued and
outstanding at the end of corresponding period. In addi-
tion to the disclosure requirements under FAS No. 128,
Earnings per Share, Toyota discloses this information in
order to provide financial statement users with valuable
information.
Yen in Thousands of
millions shares Yen U.S. dollars
Shares issued and
outstanding at Net assets Net assets
Net assets the end of the year per share per share
March 31, 2004
Net assets ...................................................................................... ¥8,178,567 3,329,921 ¥2,456.08
March 31, 2005
Net assets ...................................................................................... 9,044,950 3,268,078 2,767.67 $25.77