Toyota 2005 Annual Report Download - page 121
Download and view the complete annual report
Please find page 121 of the 2005 Toyota annual report below. You can navigate through the pages in the report by either clicking on the pages listed below, or by using the keyword search tool below to find specific information within the annual report.-
 1
1 -
2
-
3
-
4
-
5
-
6
-
7
-
8
-
9
-
10
-
11
-
12
-
13
-
14
-
15
-
16
-
17
-
18
-
19
-
20
-
21
-
22
-
23
-
24
-
25
-
26
-
27
-
28
-
29
-
30
-
31
-
32
-
33
-
34
-
35
-
36
-
37
-
38
-
39
-
40
-
41
-
42
-
43
-
44
-
45
-
46
-
47
-
48
-
49
-
50
-
51
-
52
-
53
-
54
-
55
-
56
-
57
-
58
-
59
-
60
-
61
-
62
-
63
-
64
-
65
-
66
-
67
-
68
-
69
-
70
-
71
-
72
-
73
-
74
-
75
-
76
-
77
-
78
-
79
-
80
-
81
-
82
-
83
-
84
-
85
-
86
-
87
-
88
-
89
-
90
-
91
-
92
-
93
-
94
-
95
-
96
-
97
-
98
-
99
-
100
-
101
-
102
-
103
-
104
-
105
-
106
-
107
-
108
-
109
-
110
-
 111
111 -
 112
112 -
 113
113 -
 114
114 -
 115
115 -
 116
116 -
 117
117 -
 118
118 -
 119
119 -
 120
120 -
 121
121 -
 122
122 -
 123
123 -
 124
124 -
 125
125 -
 126
126 -
 127
127 -
 128
128 -
 129
129 -
 130
130 -
 131
131 -
132
-
133
-
134
-
135
-
136
-
137
-
138
 |
 |

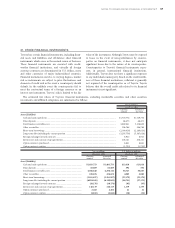
NOTES TO CONSOLIDATED FINANCIAL STATEMENTS >119
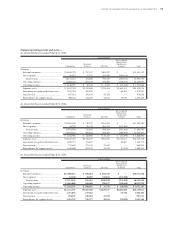
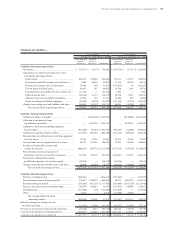
Statement of cash flows—
Yen in millions Yen in millions
For the year ended March 31, 2003 For the year ended March 31, 2004
Non-Financial Financial Non-Financial Financial
Services Services Services Services
Businesses Businesses Consolidated Businesses Businesses Consolidated
Cash flows from operating activities
Net income .......................................................................... ¥ 729,170 ¥ 22,377 ¥ 750,942 ¥ 1,074,758 ¥ 87,539 ¥ 1,162,098
Adjustments to reconcile net income to net cash
provided by operating activities
Depreciation.................................................................... 678,012 192,624 870,636 794,371 175,533 969,904
Provision for doubtful accounts and credit losses ........ 2,989 96,248 99,837 13,356 69,782 83,138
Pension and severance costs, less payments.................. 55,068 569 55,637 (159,291) 24 (159,267)
Loss on disposal of fixed assets ...................................... 46,205 287 46,492 38,708 1,034 39,742
Unrealized losses on available-for-sale securities, net .... 111,346 — 111,346 3,063 — 3,063
Deferred income taxes.................................................... (85,056) 10,777 (74,273) 82,918 37,603 120,828
Minority interest in consolidated subsidiaries.............. 10,796 735 11,531 41,886 815 42,686
Equity in earnings of affiliated companies .................... (46,309) (6,526) (52,835) (107,542) (12,753) (120,295)
Changes in operating assets and liabilities, and other....... 206,810 (50,572) 120,775 88,212 (13,546) 44,837
Net cash provided by operating activities................. 1,709,031 266,519 1,940,088 1,870,439 346,031 2,186,734
Cash flows from investing activities
Additions to finance receivables......................................... — (6,481,200) (3,439,936) — (8,126,880) (4,547,068)
Collection of and proceeds from
sale of finance receivables ................................................. — 5,825,456 2,929,151 — 6,878,953 3,395,430
Additions to fixed assets excluding equipment
leased to others .................................................................. (955,488) (50,443) (1,005,931) (923,105) (22,698) (945,803)
Additions to equipment leased to others ........................... (110,351) (493,947) (604,298) (133,214) (409,524) (542,738)
Proceeds from sales of fixed assets excluding equipment
leased to others ................................................................. 50,702 11,145 61,847 63,211 10,714 73,925
Proceeds from sales of equipment leased to others........... 64,773 221,765 286,538 78,393 210,288 288,681
Purchases of marketable securities and
security investments ......................................................... (868,227) (245,771) (1,113,998) (1,077,317) (259,150) (1,336,467)
Proceeds from sales of and maturity of
marketable securities and security investments............... 727,462 194,503 921,965 1,108,265 327,877 1,436,142
Payment for additional investments
in affiliated companies, net of cash acquired................... (28,229) — (28,229) (20,656) — (20,656)
Changes in investments and other assets, and other......... 65,499 (13,795) (8,557) (16,051) (41,054) (17,941)
Net cash used in investing activities.......................... (1,053,859) (1,032,287) (2,001,448) (920,474) (1,431,474) (2,216,495)
Cash flows from financing activities
Purchase of common stock................................................. (454,611) — (454,611) (357,457) — (357,457)
Proceeds from issuance of long-term debt ........................ 174,657 1,528,429 1,686,564 48,373 1,682,550 1,636,570
Payments of long-term debt ............................................... (224,261) (913,207) (1,117,803) (140,384) (1,187,219) (1,253,045)
Increase (decrease) in short-term borrowings................... (83,907) 166,613 30,327 (105,051) 544,806 353,833
Dividends paid..................................................................... (110,846) (30) (110,876) (137,678) — (137,678)
Other.................................................................................... 4,074 — 4,074 (15,000) 15,000 —
Net cash provided by (used in)
financing activities....................................................... (694,894) 781,805 37,675 (707,197) 1,055,137 242,223
Effect of exchange rate changes on cash
and cash equivalents ............................................................. (33,521) (7,926) (41,447) (61,623) (13,091) (74,714)
Net increase (decrease) in cash and cash equivalents ............ (73,243) 8,111 (65,132) 181,145 (43,397) 137,748
Cash and cash equivalents at beginning of year..................... 1,510,974 146,186 1,657,160 1,437,731 154,297 1,592,028
Cash and cash equivalents at end of year ............................... ¥ 1,437,731 ¥ 154,297 ¥ 1,592,028 ¥ 1,618,876 ¥ 110,900 ¥ 1,729,776