Toyota 2005 Annual Report Download - page 60
Download and view the complete annual report
Please find page 60 of the 2005 Toyota annual report below. You can navigate through the pages in the report by either clicking on the pages listed below, or by using the keyword search tool below to find specific information within the annual report.-
 1
1 -
2
-
3
-
4
-
5
-
6
-
7
-
8
-
9
-
10
-
11
-
12
-
13
-
14
-
15
-
16
-
17
-
18
-
19
-
20
-
21
-
22
-
23
-
24
-
25
-
26
-
27
-
28
-
29
-
30
-
31
-
32
-
33
-
34
-
35
-
36
-
37
-
38
-
39
-
40
-
41
-
42
-
43
-
44
-
45
-
46
-
47
-
48
-
49
-
 50
50 -
 51
51 -
 52
52 -
 53
53 -
 54
54 -
 55
55 -
 56
56 -
 57
57 -
 58
58 -
 59
59 -
 60
60 -
 61
61 -
 62
62 -
 63
63 -
 64
64 -
 65
65 -
 66
66 -
 67
67 -
 68
68 -
 69
69 -
 70
70 -
71
-
72
-
73
-
74
-
75
-
76
-
77
-
78
-
79
-
80
-
81
-
82
-
83
-
84
-
85
-
86
-
87
-
88
-
89
-
90
-
91
-
92
-
93
-
94
-
95
-
96
-
97
-
98
-
99
-
100
-
101
-
102
-
103
-
104
-
105
-
106
-
107
-
108
-
109
-
110
-
111
-
112
-
113
-
114
-
115
-
116
-
117
-
118
-
119
-
120
-
121
-
122
-
123
-
124
-
125
-
126
-
127
-
128
-
129
-
130
-
131
-
132
-
133
-
134
-
135
-
136
-
137
-
138
 |
 |

58 >MANAGEMENT’S DISCUSSION AND ANALYSIS OF FINANCIAL CONDITION AND RESULTS OF OPERATIONS
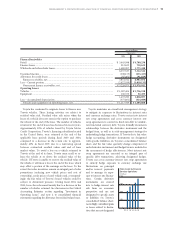
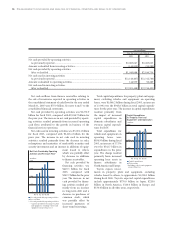
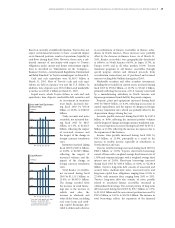
Operating Income
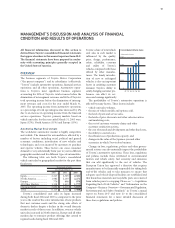
Toyota’s operating income increased by ¥5.3 billion, or
0.3%, to ¥1,672.1 billion during fiscal 2005 compared with
the prior year. Operating income was favorably affected by
the combined net impact of vehicle unit sales growth and
changes in sales mix, the impact of increased parts and
service sales, continued cost reduction efforts, growth in
the financial services operations and improvements in all
other operations. These increases were partially offset by a
reduction in the net gains on the transfer to the
government of the substitutional portion of certain
employee pension funds, increases in research and
development expenses, the impact of business expansion
and the unfavorable impact due to currency fluctuations.
As a result, operating income decreased to 9.0% for fiscal
2005 compared to 9.6% in the prior year.
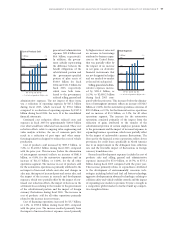
During fiscal 2005, operat-
ing income (before the
elimination of intersegment
profits) by significant geo-
graphies resulted in a
decreased of ¥120.9 billion,
or 10.9%, in Japan, and
increases of ¥56.5 billion, or
14.5%, in North America,
¥36.0 billion, or 49.8% in
Europe and ¥44.3 billion, or
45.7% in all other markets
compared with the prior
year. The decrease in Japan
relates primarily to the
impact of a decrease in the
net gains on the transfer to the government of the
substitutional portion of certain employee funds, increases
in research and development expenses and unfavorable
currency fluctuations. The decrease was partially offset by
the combined net impact of vehicle unit sales growth in
both of the domestic and export markets and changes in
sales mix and continued cost reduction efforts. The
increase in North America relates primarily to the increase
in production volume and vehicle unit sales, the impact of
cost reduction efforts in the manufacturing operations,
increases in the asset base of the financial services
operations, and lower provisions for credit losses and the
allowance for residual value losses which were partially
offset by an increase in expenses attributed to business
expansion in North America and the impact of currency
fluctuations. The increase in the European market
operating income relates mainly to the impact of cost
reduction efforts in the manufacturing operations, an increase
in production volume and vehicle unit sales and the favorable
impact of currency fluctuations, which were partially offset by
increases in expenses attributed to expansion of operations.
The increase in all other markets relates primarily to the
impact of the increase in production volume and vehicle unit
sales mainly attributed to the IMV project.
The following is a discussion of operating income for
each of Toyota’s business segments. The operating income
amounts discussed are before the elimination of interseg-
ment profits.
Automotive Operations Segment
Operating income from Toyota’s automotive operations
decreased by ¥66.5 billion, or 4.4%, to ¥1,452.5 billion
during fiscal 2005 compared with the prior year. Operating
income was unfavorably affected by the impact of the
reduction in net gains attributed to the transfer to the
government of the substitutional portion of certain employee
pension funds, the increase in research and development
expenses, the increase in expenses corresponding to business
expansion and currency fluctuations. These decreases were
partially offset by the increase in vehicle unit sales, the
increase in parts and service sales, and the impact of
continued cost reduction efforts.
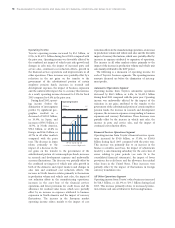
Financial Services Operations Segment
Operating income from Toyota’s financial services opera-
tions increased by ¥54.8 billion, or 37.6%, to ¥200.8
billion during fiscal 2005 compared with the prior year.
This increase was primarily due to an increase in the
finance receivables asset base, the impact of adjustments
made by a sales financing subsidiary for the correction of
errors relating to prior periods (see note 24 to the
consolidated financial statements), the impact of lower
provisions for credit losses and the allowance for residual
value losses in the United States. These increases were
partially offset by the impact of fluctuations in foreign
currency translation rates.
All Other Operations Segment
Operating income from Toyota’s other businesses increased
by ¥18.5 billion, or 121.3% to ¥33.7 billion during fiscal
2005. This increase primarily relates to increased produc-
tion volume and sales attributed to the housing business.
1,000
500
1,500
2,000
’01 ’02 ’03 ’04 ’05
0
Operating Income
FY
% of net revenues (Right scale)
(¥ Billion)
6
3
9
12
0
(%)