Toyota 2005 Annual Report Download - page 91
Download and view the complete annual report
Please find page 91 of the 2005 Toyota annual report below. You can navigate through the pages in the report by either clicking on the pages listed below, or by using the keyword search tool below to find specific information within the annual report.-
 1
1 -
2
-
3
-
4
-
5
-
6
-
7
-
8
-
9
-
10
-
11
-
12
-
13
-
14
-
15
-
16
-
17
-
18
-
19
-
20
-
21
-
22
-
23
-
24
-
25
-
26
-
27
-
28
-
29
-
30
-
31
-
32
-
33
-
34
-
35
-
36
-
37
-
38
-
39
-
40
-
41
-
42
-
43
-
44
-
45
-
46
-
47
-
48
-
49
-
50
-
51
-
52
-
53
-
54
-
55
-
56
-
57
-
58
-
59
-
60
-
61
-
62
-
63
-
64
-
65
-
66
-
67
-
68
-
69
-
70
-
71
-
72
-
73
-
74
-
75
-
76
-
77
-
78
-
79
-
80
-
 81
81 -
 82
82 -
 83
83 -
 84
84 -
 85
85 -
 86
86 -
 87
87 -
 88
88 -
 89
89 -
 90
90 -
 91
91 -
 92
92 -
 93
93 -
 94
94 -
 95
95 -
 96
96 -
 97
97 -
 98
98 -
 99
99 -
 100
100 -
 101
101 -
102
-
103
-
104
-
105
-
106
-
107
-
108
-
109
-
110
-
111
-
112
-
113
-
114
-
115
-
116
-
117
-
118
-
119
-
120
-
121
-
122
-
123
-
124
-
125
-
126
-
127
-
128
-
129
-
130
-
131
-
132
-
133
-
134
-
135
-
136
-
137
-
138
 |
 |
NOTES TO CONSOLIDATED FINANCIAL STATEMENTS >89
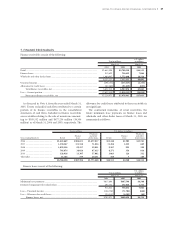
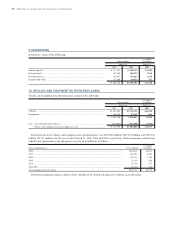
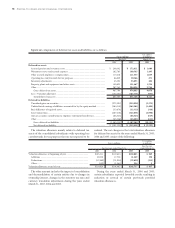
7. FINANCE RECEIVABLES
Finance receivables consist of the following:
U.S. dollars
Yen in millions in millions
March 31, March 31,
2004 2005 2005
Retail ................................................................................................................................ ¥3,643,998 ¥4,780,250 $44,513
Finance leases................................................................................................................... 912,622 758,632 7,064
Wholesale and other dealer loans ................................................................................... 1,680,907 1,773,440 16,514
6,237,527 7,312,322 68,091
Unearned income ............................................................................................................ (298,153) (233,417) (2,173)
Allowance for credit losses .............................................................................................. (87,462) (91,829) (855)
Total finance receivables, net ................................................................................. 5,851,912 6,987,076 65,063
Less—Current portion ................................................................................................... (2,622,939) (3,010,135) (28,030)
Noncurrent finance receivables, net ...................................................................... ¥3,228,973 ¥3,976,941 $37,033
As discussed in Note 4, from the year ended March 31,
2005, Toyota reclassified cash flows attributed to a certain
portion of its finance receivables in the consolidated
statements of cash flows. Included in finance receivables
are receivables relating to the sale of inventories amount-
ing to ¥595,532 million and ¥677,236 million ($6,306
million) as of March 31, 2004 and 2005, respectively. The
allowance for credit losses attributed to these receivables is
not significant.
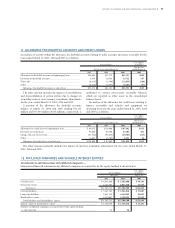
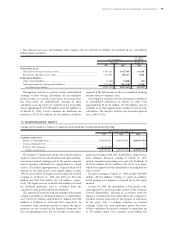
The contractual maturities of retail receivables, the
future minimum lease payments on finance leases and
wholesale and other dealer loans at March 31, 2005 are
summarized as follows:
Yen in millions U.S. dollars in millions
Wholesale Wholesale
Finance and other Finance and other
Years ending March 31 Retail lease dealer loans Retail lease dealer loans
2006 ............................................... ¥1,422,669 ¥204,611 ¥1,477,817 $13,248 $1,905 $13,761
2007 ............................................... 1,230,247 131,518 71,824 11,456 1,225 669
2008 ............................................... 1,029,558 99,357 59,051 9,587 925 550
2009 ............................................... 705,674 38,024 87,415 6,571 354 814
2010 ............................................... 328,916 13,307 57,082 3,063 124 532
Thereafter....................................... 63,186 779 20,251 588 7 188
¥4,780,250 ¥487,596 ¥1,773,440 $44,513 $4,540 $16,514
Finance leases consist of the following:
U.S. dollars
Yen in millions in millions
March 31, March 31,
2004 2005 2005
Minimum lease payments ............................................................................................... ¥617,890 ¥487,596 $4,540
Estimated unguaranteed residual values ........................................................................ 294,732 271,036 2,524
912,622 758,632 7,064
Less—Unearned income ................................................................................................ (104,736) (71,702) (668)
Less—Allowance for credit losses .................................................................................. (25,015) (6,502) (60)
Finance leases, net.................................................................................................. ¥782,871 ¥680,428 $6,336