Toyota 2005 Annual Report Download - page 96
Download and view the complete annual report
Please find page 96 of the 2005 Toyota annual report below. You can navigate through the pages in the report by either clicking on the pages listed below, or by using the keyword search tool below to find specific information within the annual report.-
 1
1 -
2
-
3
-
4
-
5
-
6
-
7
-
8
-
9
-
10
-
11
-
12
-
13
-
14
-
15
-
16
-
17
-
18
-
19
-
20
-
21
-
22
-
23
-
24
-
25
-
26
-
27
-
28
-
29
-
30
-
31
-
32
-
33
-
34
-
35
-
36
-
37
-
38
-
39
-
40
-
41
-
42
-
43
-
44
-
45
-
46
-
47
-
48
-
49
-
50
-
51
-
52
-
53
-
54
-
55
-
56
-
57
-
58
-
59
-
60
-
61
-
62
-
63
-
64
-
65
-
66
-
67
-
68
-
69
-
70
-
71
-
72
-
73
-
74
-
75
-
76
-
77
-
78
-
79
-
80
-
81
-
82
-
83
-
84
-
85
-
 86
86 -
 87
87 -
 88
88 -
 89
89 -
 90
90 -
 91
91 -
 92
92 -
 93
93 -
 94
94 -
 95
95 -
 96
96 -
 97
97 -
 98
98 -
 99
99 -
 100
100 -
 101
101 -
 102
102 -
 103
103 -
 104
104 -
 105
105 -
 106
106 -
107
-
108
-
109
-
110
-
111
-
112
-
113
-
114
-
115
-
116
-
117
-
118
-
119
-
120
-
121
-
122
-
123
-
124
-
125
-
126
-
127
-
128
-
129
-
130
-
131
-
132
-
133
-
134
-
135
-
136
-
137
-
138
 |
 |

94 >NOTES TO CONSOLIDATED FINANCIAL STATEMENTS
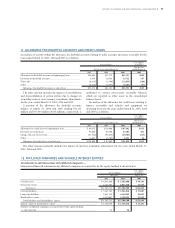
Entities comprising a significant portion of Toyota’s
investment in affiliated companies include Denso
Corporation; Aioi Insurance Co., Ltd.; Toyota Industries
Corporation; Toyota Tsusho Corporation; and Aisin Seiki
Co., Ltd.
Certain affiliated companies accounted for by the equity
method with carrying amounts of ¥1,024,084 million and
¥1,235,535 million ($11,505 million) at March 31, 2004
and 2005, respectively, were quoted on various established
markets at an aggregate value of ¥1,383,398 million and
¥1,827,725 million ($17,020 million), respectively.
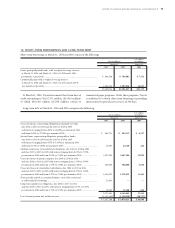
Dividends from affiliated companies accounted for by
the equity method for the years ended March 31, 2003,
2004 and 2005 were ¥18,270 million, ¥15,722 million and
¥22,164 million ($206 million), respectively.
Toyota has convertible debt securities issued by
affiliated companies accounted for by the equity method,
which were included in “Investments and other assets—
Affiliated companies” in the consolidated balance sheets at
fair value. Fair value of those securities as of March 31,
2004 and 2005 were ¥8,005 million and ¥11,124 million
($104 million), respectively. Maturities of these converti-
ble debt securities are in one year.
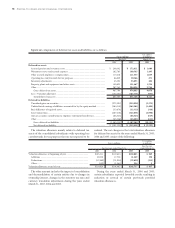
Variable interest entities—
Toyota enters into securitization transactions with certain
special-purpose entities. However, substantially all securi-
tization transactions are with entities that are qualifying
special-purpose entities under FAS 140 and thus no
material variable interest entities (“VIEs”) relating to these
securitization transactions.
Certain joint ventures in which Toyota has invested are
VIEs for which Toyota is not the primary beneficiary.
However, neither the aggregate size of these joint ventures
nor Toyota’s involvements in these entities are material to
Toyota’s consolidated financial statements.
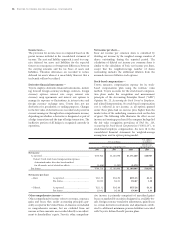
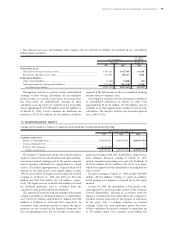
U.S. dollars
Yen in millions in millions
For the year
For the years ended March 31, ended March 31,
2003 2004 2005 2005
Net revenues...................................................................................... ¥13,661,769 ¥13,187,869 ¥15,359,634 $143,027
Gross profit ....................................................................................... ¥ 1,654,250 ¥ 1,650,233 ¥ 1,900,344 $ 17,696
Net income........................................................................................ ¥ 187,330 ¥ 403,213 ¥ 420,640 $ 3,917
Account balances and transactions with affiliated companies are presented below:
U.S. dollars
Yen in millions in millions
March 31, March 31,
2004 2005 2005
Trade accounts and notes receivable, and other receivables ......................................... ¥129,036 ¥179,519 $1,672
Accounts payable and other payables............................................................................. 460,730 463,870 4,319
U.S. dollars
Yen in millions in millions
For the year
For the years ended March 31, ended March 31,
2003 2004 2005 2005
Net revenues...................................................................................... ¥ 921,636 ¥ 883,112 ¥1,150,523 $10,714
Purchases........................................................................................... 3,725,315 2,577,696 2,923,325 27,222