Toyota 2005 Annual Report Download - page 120
Download and view the complete annual report
Please find page 120 of the 2005 Toyota annual report below. You can navigate through the pages in the report by either clicking on the pages listed below, or by using the keyword search tool below to find specific information within the annual report.-
 1
1 -
2
-
3
-
4
-
5
-
6
-
7
-
8
-
9
-
10
-
11
-
12
-
13
-
14
-
15
-
16
-
17
-
18
-
19
-
20
-
21
-
22
-
23
-
24
-
25
-
26
-
27
-
28
-
29
-
30
-
31
-
32
-
33
-
34
-
35
-
36
-
37
-
38
-
39
-
40
-
41
-
42
-
43
-
44
-
45
-
46
-
47
-
48
-
49
-
50
-
51
-
52
-
53
-
54
-
55
-
56
-
57
-
58
-
59
-
60
-
61
-
62
-
63
-
64
-
65
-
66
-
67
-
68
-
69
-
70
-
71
-
72
-
73
-
74
-
75
-
76
-
77
-
78
-
79
-
80
-
81
-
82
-
83
-
84
-
85
-
86
-
87
-
88
-
89
-
90
-
91
-
92
-
93
-
94
-
95
-
96
-
97
-
98
-
99
-
100
-
101
-
102
-
103
-
104
-
105
-
106
-
107
-
108
-
109
-
 110
110 -
 111
111 -
 112
112 -
 113
113 -
 114
114 -
 115
115 -
 116
116 -
 117
117 -
 118
118 -
 119
119 -
 120
120 -
 121
121 -
 122
122 -
 123
123 -
 124
124 -
 125
125 -
 126
126 -
 127
127 -
 128
128 -
 129
129 -
 130
130 -
131
-
132
-
133
-
134
-
135
-
136
-
137
-
138
 |
 |

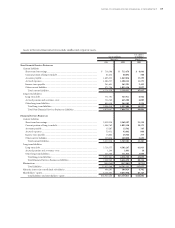
118 >NOTES TO CONSOLIDATED FINANCIAL STATEMENTS
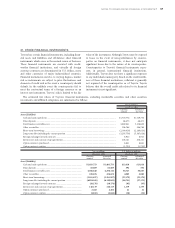
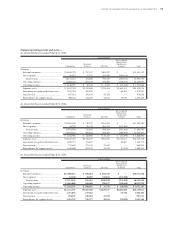
Statement of income—
U.S. dollars
Yen in millions in millions
For the year
For the year ended March 31, ended March 31,
2003 2004 2005 2005
Non-Financial Services Businesses
Net revenues................................................................................... ¥14,803,475 ¥16,586,814 ¥17,800,357 $165,754
Costs and expenses
Cost of revenues ........................................................................ 11,915,394 13,507,835 14,497,252 134,996
Selling, general and administrative .......................................... 1,631,151 1,540,724 1,813,288 16,885
Total costs and expenses....................................................... 13,546,545 15,048,559 16,310,540 151,881
Operating income.......................................................................... 1,256,930 1,538,255 1,489,817 13,873
Other income (expense), net......................................................... (48,563) 97,885 68,736 640
Income before income taxes, minority interest and equity
in earnings of affiliated companies ............................................. 1,208,367 1,636,140 1,558,553 14,513
Provision for income taxes............................................................ 514,710 627,038 578,709 5,389
Income before minority interest and equity
in earnings of affiliated companies ............................................. 693,657 1,009,102 979,844 9,124
Minority interest in consolidated subsidiaries............................. (10,796) (41,886) (63,952) (596)
Equity in earnings of affiliated companies ................................... 46,309 107,542 131,849 1,228
Net income- Non-Financial Services Businesses ........................ 729,170 1,074,758 1,047,741 9,756
Financial Services Businesses
Net revenues................................................................................... 724,898 736,852 781,261 7,275
Costs and expenses
Cost of revenues ........................................................................ 425,691 365,750 376,150 3,503
Selling, general and administrative .......................................... 268,879 225,104 204,258 1,902
Total costs and expenses....................................................... 694,570 590,854 580,408 5,405
Operating income.......................................................................... 30,328 145,998 200,853 1,870
Other expense, net ......................................................................... (11,444) (16,438) (4,764) (44)
Income before income taxes, minority interest and equity
in earnings of affiliated companies .............................................. 18,884 129,560 196,089 1,826
Provision for income taxes............................................................ 2,298 53,959 78,748 733
Income before minority interest and equity
in earnings of affiliated companies .............................................. 16,586 75,601 117,341 1,093
Minority interest in consolidated subsidiaries............................. (735) (815) (988) (9)
Equity in earnings of affiliated companies ................................... 6,526 12,753 7,622 71
Net income- Financial Services Businesses .................................. 22,377 87,539 123,975 1,155
Eliminations................................................................................... (605) (199) (456) (4)
Net income..................................................................................... ¥ 750,942 ¥ 1,162,098 ¥ 1,171,260 $ 10,907