Toyota 2005 Annual Report Download - page 68
Download and view the complete annual report
Please find page 68 of the 2005 Toyota annual report below. You can navigate through the pages in the report by either clicking on the pages listed below, or by using the keyword search tool below to find specific information within the annual report.-
 1
1 -
2
-
3
-
4
-
5
-
6
-
7
-
8
-
9
-
10
-
11
-
12
-
13
-
14
-
15
-
16
-
17
-
18
-
19
-
20
-
21
-
22
-
23
-
24
-
25
-
26
-
27
-
28
-
29
-
30
-
31
-
32
-
33
-
34
-
35
-
36
-
37
-
38
-
39
-
40
-
41
-
42
-
43
-
44
-
45
-
46
-
47
-
48
-
49
-
50
-
51
-
52
-
53
-
54
-
55
-
56
-
57
-
 58
58 -
 59
59 -
 60
60 -
 61
61 -
 62
62 -
 63
63 -
 64
64 -
 65
65 -
 66
66 -
 67
67 -
 68
68 -
 69
69 -
 70
70 -
 71
71 -
 72
72 -
 73
73 -
 74
74 -
 75
75 -
 76
76 -
 77
77 -
 78
78 -
79
-
80
-
81
-
82
-
83
-
84
-
85
-
86
-
87
-
88
-
89
-
90
-
91
-
92
-
93
-
94
-
95
-
96
-
97
-
98
-
99
-
100
-
101
-
102
-
103
-
104
-
105
-
106
-
107
-
108
-
109
-
110
-
111
-
112
-
113
-
114
-
115
-
116
-
117
-
118
-
119
-
120
-
121
-
122
-
123
-
124
-
125
-
126
-
127
-
128
-
129
-
130
-
131
-
132
-
133
-
134
-
135
-
136
-
137
-
138
 |
 |

66 >MANAGEMENT’S DISCUSSION AND ANALYSIS OF FINANCIAL CONDITION AND RESULTS OF OPERATIONS
services operations. At March
31, 2005, approximately 38%
of long-term debt was
denominated in U.S. dollars,
27% in Japanese yen, 17% in
euros and 18% in other
currencies. Toyota hedges
fixed rate exposure by enter-
ing into interest rate swaps.
There are no material sea-
sonal variations in Toyota’s
borrowings requirements.
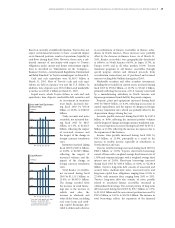
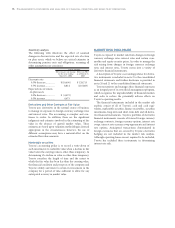
As of March 31, 2005,
Toyota’s total interest bearing
debt was 94.5% of total
shareholders’ equity, com-
pared to 92.5% as of March 31, 2004.
Toyota’s long-term debt was rated “AAA” by Standard
& Poor’s Ratings Group, “Aaa” by Moody’s Investors
Services and “AAA” by Rating and Investment
Information, Inc. as of March 31, 2005. These ratings
represent the highest long-term debt ratings published by
each of the respective rating agencies. A credit rating is not
a recommendation to buy, sell or hold securities. A credit
rating may be subject to withdrawal or revision at any
time. Each rating should be evaluated separately of any
other rating.
Toyota’s treasury policy is to maintain controls on all
exposures, to adhere to stringent counterparty credit
standards, and to actively monitor marketplace exposures.
Toyota centralized, and is pursuing global efficiency of, its
financial services operations through Toyota Financial
Services Corporation.
The key element of Toyota’s financial policy is maintain-
ing a strong financial position that will allow Toyota to
fund its research and development initiatives, capital
expenditures and financing operations on a cost effective
basis even if earnings experience short-term fluctuations.
Toyota believes that it maintains sufficient liquidity for its
present requirements and that by maintaining their high
credit ratings, it will continue to be able to access funds
from external sources in large amounts and at relatively
low costs. Toyota’s ability to maintain its high credit
ratings is subject to a number of factors, some of which
are not within Toyota’s control. These factors include
general economic conditions in Japan and the other major
markets in which Toyota does business, as well as Toyota’s
successful implementation of its business strategy.
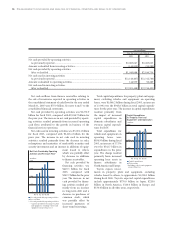
Toyota’s unfunded pension liabilities decreased during
fiscal 2005 by ¥325.2 billion, or 38.7% to ¥516.0 billion. The
unfunded pension liabilities relate primarily to the parent
company and its Japanese subsidiaries. The unfunded
amounts will be funded through future cash contributions
by Toyota and its employees or in some cases will be funded
on the retirement date of each covered employee. The
unfunded pension liabilities decreased in fiscal 2005
compared to the prior year due to the transfer to the
government of the substitutional portion of certain
employee pension funds in some of Toyota’s subsidiaries,
cash contributions to the plans and the increase in the
market value of assets of the plans. See note 19 to the
consolidated financial statements.
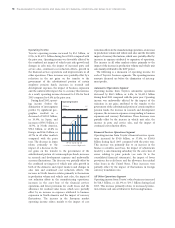
5,000
2,500
7,500
10,000
’01 ’02 ’03 ’04 ’05
0
Shareholders’ Equity
and Equity Ratio
(¥ Billion)
FY
Equity ratio (Right scale)
30
15
45
60
0
(%)