Toyota 2009 Annual Report Download - page 102
Download and view the complete annual report
Please find page 102 of the 2009 Toyota annual report below. You can navigate through the pages in the report by either clicking on the pages listed below, or by using the keyword search tool below to find specific information within the annual report.-
 1
1 -
2
-
3
-
4
-
5
-
6
-
7
-
8
-
9
-
10
-
11
-
12
-
13
-
14
-
15
-
16
-
17
-
18
-
19
-
20
-
21
-
22
-
23
-
24
-
25
-
26
-
27
-
28
-
29
-
30
-
31
-
32
-
33
-
34
-
35
-
36
-
37
-
38
-
39
-
40
-
41
-
42
-
43
-
44
-
45
-
46
-
47
-
48
-
49
-
50
-
51
-
52
-
53
-
54
-
55
-
56
-
57
-
58
-
59
-
60
-
61
-
62
-
63
-
64
-
65
-
66
-
67
-
68
-
69
-
70
-
71
-
72
-
73
-
74
-
75
-
76
-
77
-
78
-
79
-
80
-
81
-
82
-
83
-
84
-
85
-
86
-
87
-
88
-
89
-
90
-
91
-
 92
92 -
 93
93 -
 94
94 -
 95
95 -
 96
96 -
 97
97 -
 98
98 -
 99
99 -
 100
100 -
 101
101 -
 102
102 -
 103
103 -
 104
104 -
 105
105 -
 106
106 -
 107
107 -
 108
108 -
 109
109 -
 110
110 -
 111
111 -
 112
112
 |
 |

Financial Section
TOYOTA MOTOR CORPORATION
100
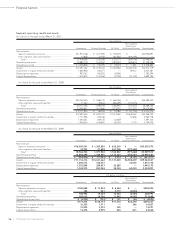
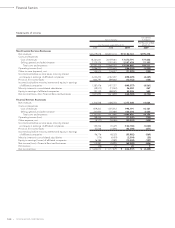
Statements of income
U.S. dollars
Yen in millions in millions
For the year ended
For the years ended March 31, March 31,
2007 2008 2009 2009
Non-Financial Services Businesses
Net revenues ................................................................................................. ¥22,679,078 ¥24,831,172 ¥19,182,161 $195,278
Costs and expenses
Cost of revenues ....................................................................................... 18,361,641 20,459,061 17,470,791 177,856
Selling, general and administrative ......................................................... 2,230,734 2,181,491 2,097,674 21,355
Total costs and expenses...................................................................... 20,592,375 22,640,552 19,568,465 199,211
Operating income (loss) ............................................................................... 2,086,703 2,190,620 (386,304) (3,933)
Other income (expense), net ....................................................................... 145,570 176,417 (71,925) (732)
Income (loss) before income taxes, minority interest
and equity in earnings of affiliated companies ........................................ 2,232,273 2,367,037 (458,229) (4,665)
Provision for income taxes ........................................................................... 844,797 889,660 (10,152) (104)
Income (loss) before minority interest and equity in earnings
of affiliated companies ............................................................................... 1,387,476 1,477,377 (448,077) (4,561)
Minority interest in consolidated subsidiaries ............................................ (49,513) (73,543) 26,282 267
Equity in earnings of affiliated companies.................................................. 193,130 268,025 53,226 542
Net income (loss)—Non-Financial Services Businesses ........................... 1,531,093 1,671,859 (368,569) (3,752)
Financial Services Businesses
Net revenues ................................................................................................. 1,300,548 1,498,354 1,377,548 14,024
Costs and expenses
Cost of revenues ....................................................................................... 879,203 1,075,972 994,191 10,121
Selling, general and administrative ......................................................... 262,850 335,888 455,304 4,635
Total costs and expenses...................................................................... 1,142,053 1,411,860 1,449,495 14,756
Operating income (loss) ............................................................................... 158,495 86,494 (71,947) (732)
Other expense, net ....................................................................................... (8,171) (16,265) (30,233) (308)
Income (loss) before income taxes, minority interest
and equity in earnings of affiliated companies ........................................ 150,324 70,229 (102,180) (1,040)
Provision for income taxes ........................................................................... 53,548 21,904 (46,298) (471)
Income (loss) before minority interest and equity in earnings
of affiliated companies ............................................................................... 96,776 48,325 (55,882) (569)
Minority interest in consolidated subsidiaries ............................................ (174) (4,419) (2,004) (20)
Equity in earnings (losses) of affiliated companies .................................... 16,385 2,089 (10,502) (107)
Net income (loss)—Financial Services Businesses ..................................... 112,987 45,995 (68,388) (696)
Eliminations ................................................................................................... (48) 25 20 0
Net income (loss) .......................................................................................... ¥ 1,644,032 ¥ 1,717,879 ¥ (436,937) $ (4,448)