Toyota 2009 Annual Report Download - page 48
Download and view the complete annual report
Please find page 48 of the 2009 Toyota annual report below. You can navigate through the pages in the report by either clicking on the pages listed below, or by using the keyword search tool below to find specific information within the annual report.-
 1
1 -
2
-
3
-
4
-
5
-
6
-
7
-
8
-
9
-
10
-
11
-
12
-
13
-
14
-
15
-
16
-
17
-
18
-
19
-
20
-
21
-
22
-
23
-
24
-
25
-
26
-
27
-
28
-
29
-
30
-
31
-
32
-
33
-
34
-
35
-
36
-
37
-
 38
38 -
 39
39 -
 40
40 -
 41
41 -
 42
42 -
 43
43 -
 44
44 -
 45
45 -
 46
46 -
 47
47 -
 48
48 -
 49
49 -
 50
50 -
 51
51 -
 52
52 -
 53
53 -
 54
54 -
 55
55 -
 56
56 -
 57
57 -
 58
58 -
59
-
60
-
61
-
62
-
63
-
64
-
65
-
66
-
67
-
68
-
69
-
70
-
71
-
72
-
73
-
74
-
75
-
76
-
77
-
78
-
79
-
80
-
81
-
82
-
83
-
84
-
85
-
86
-
87
-
88
-
89
-
90
-
91
-
92
-
93
-
94
-
95
-
96
-
97
-
98
-
99
-
100
-
101
-
102
-
103
-
104
-
105
-
106
-
107
-
108
-
109
-
110
-
111
-
112
 |
 |
Financial Section
TOYOTA MOTOR CORPORATION
46
All financial information discussed in this section is derived
from Toyota’s consolidated financial statements that
appear elsewhere in this annual report on Form 20-F. The
financial statements have been prepared in conformity
with accounting principles generally accepted in the
United States of America.
Overview
The business segments of Toyota include automotive operations,
financial services operations and all other operations. Automotive
operations is Toyota’s most significant business segment,
accounting for 88% of Toyota’s total revenues before the elimi-
nation of intersegment revenues for fiscal 2009. Toyota’s primary
markets based on vehicle unit sales for fiscal 2009 were: Japan
(26%), North America (29%), Europe (14%) and Asia (12%).
Automotive Market Environment
The worldwide automotive market is highly competitive and vol-
atile. The demand for automobiles is affected by a number of
factors including social, political and general economic condi-
tions; introduction of new vehicles and technologies; and costs
incurred by customers to purchase and operate vehicles. These
factors can cause consumer demand to vary substantially from
year to year in different geographic markets and for different
types of automobiles.
The automotive industry experienced a rapid contraction of
markets globally during fiscal 2009 due to a severe downturn in
the economy stemming from a global financial crisis, and result-
ed in an extremely severe condition. Particularly in Japan, the
United States, and Europe, the markets declined severely in the
second half of fiscal 2009. The markets in resource-rich countries
and emerging countries, which were growing continuously,
encountered a sudden slowdown in growth.
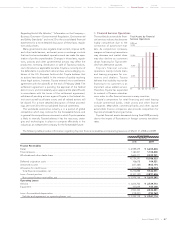
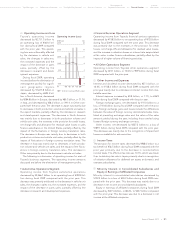
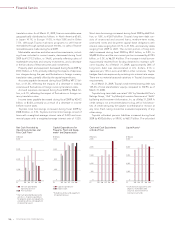
The following table sets forth Toyota’s consolidated vehicle
unit sales by geographic market based on location of customers
for the past three fiscal years.
Thousands of units
Years ended March 31,
2007 2008 2009
Japan ................................................. 2,273 2,188 1,945
North America .................................. 2,942 2,958 2,212
Europe ............................................... 1,224 1,284 1,062
Asia .................................................... 789 956 905
Other* ................................................ 1,296 1,527 1,443
Overseas total ................................... 6,251 6,725 5,622
Total ................................................... 8,524 8,913 7,567
* “Other” consists of Central and South America, Oceania, Africa and the
Middle East, etc.
Toyota’s consolidated vehicle unit sales in Japan decreased dur-
ing fiscal 2008 and 2009 as compared to each of the respective
prior years reflecting a decline in the overall domestic market.
During fiscal 2009, however,
Toyota and Lexus brands’ market
share excluding mini-vehicles,
and Toyota’s market share
(including Daihatsu and Hino
brands) including mini-vehicles
represented a record high reflect-
ing the sales efforts of domestic
dealers. Overseas vehicle unit
sales increased during fiscal
2008, but decreased during fiscal
2009. During fiscal 2008, vehicle
unit sales increased in North
America, Europe, Asia and Other
reflecting the expansion of pro-
duction sites, the introduction of
vehicle models that effectively
met customer needs and the
implementation of various sales measures. During fiscal 2009,
vehicle unit sales decreased, particularly in North America
and Europe, where the contraction of automotive markets was
especially pronounced.
Toyota’s share of total vehicle unit sales in each market is influ-
enced by the quality, price, design, performance, safety, reliabil-
ity, economy and utility of Toyota’s vehicles compared with those
offered by other manufacturers. The timely introduction of new
or redesigned vehicles is also an important factor in satisfying
customer needs. Toyota’s ability to satisfy changing customer
preferences can affect its revenues and earnings significantly.
The profitability of Toyota’s automotive operations is affected
by many factors. These factors include:
• vehicle unit sales volumes,
• the mix of vehicle models and options sold,
• the level of parts and service sales,
• the levels of price discounts and other sales incentives and
marketing costs,
• the cost of customer warranty claims and other customer
satisfaction actions,
• the cost of research and development and other fixed costs,
• the prices of raw materials,
• the ability to control costs,
• the efficient use of production capacity, and
• changes in the value of the Japanese yen and other currencies
in which Toyota does business.
Changes in laws, regulations, policies and other governmental
actions can also materially impact the profitability of Toyota’s
automotive operations. These laws, regulations and policies
include those attributed to environmental matters and vehicle
safety, fuel economy and emissions that can add significantly to
the cost of vehicles. The European Union has enforced a direc-
tive that requires manufacturers to be financially responsible for
taking back end-of-life vehicles and to take measures to ensure
that adequate used vehicle disposal facilities are established and
those hazardous materials and recyclable parts are removed
from vehicles prior to scrapping. Please see “—Legislation
Management’s Discussion and Analysis
of Financial Condition and Results of Operations
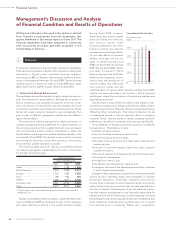
Consolidated Vehicle Sales
0
2,000
4,000
6,000
8,000
10,000
(Thousands of units)
’08’07 ’09’06’05FY