Toyota 2009 Annual Report Download - page 105
Download and view the complete annual report
Please find page 105 of the 2009 Toyota annual report below. You can navigate through the pages in the report by either clicking on the pages listed below, or by using the keyword search tool below to find specific information within the annual report.-
 1
1 -
2
-
3
-
4
-
5
-
6
-
7
-
8
-
9
-
10
-
11
-
12
-
13
-
14
-
15
-
16
-
17
-
18
-
19
-
20
-
21
-
22
-
23
-
24
-
25
-
26
-
27
-
28
-
29
-
30
-
31
-
32
-
33
-
34
-
35
-
36
-
37
-
38
-
39
-
40
-
41
-
42
-
43
-
44
-
45
-
46
-
47
-
48
-
49
-
50
-
51
-
52
-
53
-
54
-
55
-
56
-
57
-
58
-
59
-
60
-
61
-
62
-
63
-
64
-
65
-
66
-
67
-
68
-
69
-
70
-
71
-
72
-
73
-
74
-
75
-
76
-
77
-
78
-
79
-
80
-
81
-
82
-
83
-
84
-
85
-
86
-
87
-
88
-
89
-
90
-
91
-
92
-
93
-
94
-
 95
95 -
 96
96 -
 97
97 -
 98
98 -
 99
99 -
 100
100 -
 101
101 -
 102
102 -
 103
103 -
 104
104 -
 105
105 -
 106
106 -
 107
107 -
 108
108 -
 109
109 -
 110
110 -
 111
111 -
 112
112
 |
 |

The Right Way Forward Business OverviewPerformance Overview Financial Section
Investor
Information
Management &
Corporate Information
Top Messages
Annual Report 2009 103
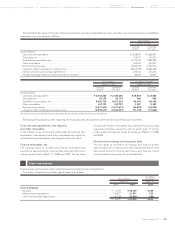
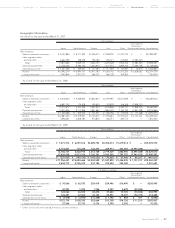
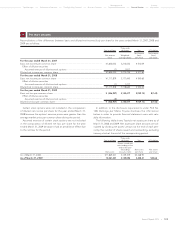
Reconciliations of the differences between basic and diluted net income (loss) per share for the years ended March 31, 2007, 2008 and
2009 are as follows:
Thousands
Yen in millions of shares Yen U.S. dollars
Net income Net income
Net income Weighted- (loss) (loss)
(loss) average shares per share per share
For the year ended March 31, 2007
Basic net income per common share................................................................................ ¥1,644,032 3,210,422 ¥ 512.09
Effect of dilutive securities
Assumed exercise of dilutive stock options ............................................................. (2) 1,812
Diluted net income per common share ............................................................................ ¥1,644,030 3,212,234 ¥ 511.80
For the year ended March 31, 2008
Basic net income per common share................................................................................ ¥1,717,879 3,177,445 ¥ 540.65
Effect of dilutive securities
Assumed exercise of dilutive stock options ............................................................. (1) 1,217
Diluted net income per common share ............................................................................ ¥1,717,878 3,178,662 ¥ 540.44
For the year ended March 31, 2009
Basic net loss per common share ......................................................................................
¥ (436,937) 3,140,417 ¥(139.13) $(1.42)
Effect of dilutive securities
Assumed exercise of dilutive stock options .............................................................
(0)
—
Diluted net loss per common share ..................................................................................
¥ (436,937) 3,140,417 ¥(139.13) $(1.42)
Thousands
Yen in millions of shares Yen U.S. dollars
Shares issued and
outstanding at the
end of the year
(excluding Net assets Net assets
Net assets treasury stock) per share per share
As of March 31, 2008 .......................................................................................................... ¥11,869,527 3,149,279 ¥3,768.97
As of March 31, 2009 .......................................................................................................
10,061,207 3,135,882 3,208.41 $32.66
Certain stock options were not included in the computation
of diluted net income per share for the year ended March 31,
2008 because the options’ exercise prices were greater than the
average market price per common share during the period.
Assumed exercise of certain stock options was not included
in the computation of diluted net loss per share for the year
ended March 31, 2009 because it had an antidilutive effect due
to the net loss for the period.
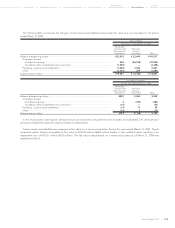
In addition to the disclosure requirements under FAS No.
128, Earnings per Share, Toyota discloses the information
below in order to provide financial statement users with valu-
able information.
The following table shows Toyota’s net assets per share as of
March 31, 2008 and 2009. Net assets per share amounts are cal-
culated by dividing net assets’ amount at the end of each peri-
od by the number of shares issued and outstanding, excluding
treasury stock at the end of the corresponding period.
Per share amounts:
25