Toyota 2009 Annual Report Download - page 106
Download and view the complete annual report
Please find page 106 of the 2009 Toyota annual report below. You can navigate through the pages in the report by either clicking on the pages listed below, or by using the keyword search tool below to find specific information within the annual report.-
 1
1 -
2
-
3
-
4
-
5
-
6
-
7
-
8
-
9
-
10
-
11
-
12
-
13
-
14
-
15
-
16
-
17
-
18
-
19
-
20
-
21
-
22
-
23
-
24
-
25
-
26
-
27
-
28
-
29
-
30
-
31
-
32
-
33
-
34
-
35
-
36
-
37
-
38
-
39
-
40
-
41
-
42
-
43
-
44
-
45
-
46
-
47
-
48
-
49
-
50
-
51
-
52
-
53
-
54
-
55
-
56
-
57
-
58
-
59
-
60
-
61
-
62
-
63
-
64
-
65
-
66
-
67
-
68
-
69
-
70
-
71
-
72
-
73
-
74
-
75
-
76
-
77
-
78
-
79
-
80
-
81
-
82
-
83
-
84
-
85
-
86
-
87
-
88
-
89
-
90
-
91
-
92
-
93
-
94
-
95
-
 96
96 -
 97
97 -
 98
98 -
 99
99 -
 100
100 -
 101
101 -
 102
102 -
 103
103 -
 104
104 -
 105
105 -
 106
106 -
 107
107 -
 108
108 -
 109
109 -
 110
110 -
 111
111 -
 112
112
 |
 |
Financial Section
TOYOTA MOTOR CORPORATION
104
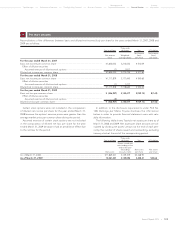
The following is a description of the valuation methodologies
used for the assets and liabilities measured at fair value, key
inputs and significant assumptions:
Cash equivalents
Cash equivalents represent highly liquid investments with origi-
nal maturities of three months or less. Generally, quoted market
prices are used to determine the fair value of these instruments.
Marketable securities and other securities investments
Marketable securities and other securities investments include
debt securities and equity securities. Toyota uses quoted market
prices for identical or similar assets or liabilities to measure fair
value. Marketable securities and other securities investments
classified as Level 3 include retained interests in securitized
financial receivables, which are measured at fair value using the
assumptions such as interest rate, loss severity and other factors.
Derivative fi nancial instruments
Toyota estimates the fair value of derivative financial instruments
using industry-standard valuation models that requires observ-
able inputs including interest rates and foreign exchange rates,
and the contractual terms. In other certain cases when market
data is not available, key inputs to the fair value measurement
include quotes from counterparties, and other market data.
Toyota’s derivative fair value measurements consider assump-
tions about counterparty and our own non-performance risk,
using such as credit default probabilities.
Toyota adopted FAS 157 in the fiscal year ended March 31, 2009. In FAS 157, three levels of input which are used to measure fair value
are as follows.
Level 1: Quoted prices in active markets for identical assets or liabilities
Level 2: Quoted prices for similar assets or liabilities in active markets; quoted prices for identical or similar assets or liabilities in
markets that are not active; inputs other than quoted prices that are observable for the assets or liabilities
Level 3: Unobservable inputs for assets or liabilities
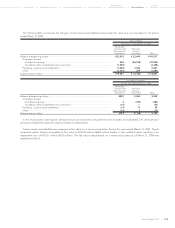
The following table summarizes the fair values of the assets and liabilities measured at fair value on a recurring basis at March 31, 2009:
Yen in millions
March 31, 2009
Level 1 Level 2 Level 3 Total
Assets:
Cash equivalents ......................................................................................................... ¥1,473,407 ¥ 115,339 ¥ — ¥1,588,746
Marketable securities and other securities investments ......................................... 2,273,294 187,236 19,581 2,480,111
Derivative financial instruments ................................................................................. — 369,572 17,958 387,530
Total .......................................................................................................................... ¥3,746,701 ¥ 672,147 ¥ 37,539 ¥4,456,387
Liabilities:
Derivative financial instruments ................................................................................. ¥ — ¥(427,109) ¥(23,692) ¥ (450,801)
Total .......................................................................................................................... ¥ — ¥(427,109) ¥(23,692) ¥ (450,801)
U.S. dollars in millions
March 31, 2009
Level 1 Level 2 Level 3 Total
Assets:
Cash equivalents ......................................................................................................... $15,000 $ 1,174 $ — $16,174
Marketable securities and other securities investments ......................................... 23,143 1,906 199 25,248
Derivative financial instruments ................................................................................. — 3,762 183 3,945
Total .......................................................................................................................... $38,143 $ 6,842 $ 382 $45,367
Liabilities:
Derivative financial instruments ................................................................................. $ — $(4,348) $(241) $ (4,589)
Total .......................................................................................................................... $ — $(4,348) $(241) $ (4,589)
Fair value measurements:
26