Toyota 2009 Annual Report Download - page 88
Download and view the complete annual report
Please find page 88 of the 2009 Toyota annual report below. You can navigate through the pages in the report by either clicking on the pages listed below, or by using the keyword search tool below to find specific information within the annual report.-
 1
1 -
2
-
3
-
4
-
5
-
6
-
7
-
8
-
9
-
10
-
11
-
12
-
13
-
14
-
15
-
16
-
17
-
18
-
19
-
20
-
21
-
22
-
23
-
24
-
25
-
26
-
27
-
28
-
29
-
30
-
31
-
32
-
33
-
34
-
35
-
36
-
37
-
38
-
39
-
40
-
41
-
42
-
43
-
44
-
45
-
46
-
47
-
48
-
49
-
50
-
51
-
52
-
53
-
54
-
55
-
56
-
57
-
58
-
59
-
60
-
61
-
62
-
63
-
64
-
65
-
66
-
67
-
68
-
69
-
70
-
71
-
72
-
73
-
74
-
75
-
76
-
77
-
 78
78 -
 79
79 -
 80
80 -
 81
81 -
 82
82 -
 83
83 -
 84
84 -
 85
85 -
 86
86 -
 87
87 -
 88
88 -
 89
89 -
 90
90 -
 91
91 -
 92
92 -
 93
93 -
 94
94 -
 95
95 -
 96
96 -
 97
97 -
 98
98 -
99
-
100
-
101
-
102
-
103
-
104
-
105
-
106
-
107
-
108
-
109
-
110
-
111
-
112
 |
 |
Financial Section
TOYOTA MOTOR CORPORATION
86
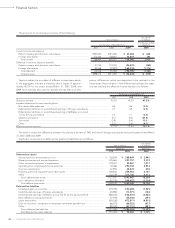
2007 2008 2009
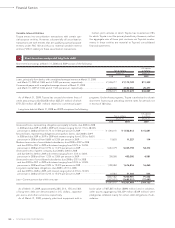
Dividend rate ............................................................................................................................... 1.5% 1.7% 3.0%
Risk-free interest rate................................................................................................................... 1.4% 1.3% 1.1%
Expected volatility ....................................................................................................................... 27% 23% 23%
Expected holding period (years) ................................................................................................ 5.0 5.0 5.0
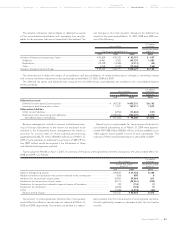
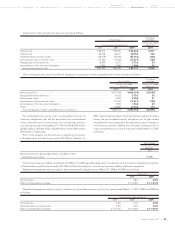
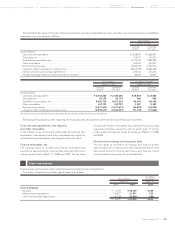
The following table summarizes Toyota’s stock option activity:
Yen
Yen in millions
Weighted-average
remaining Aggregate
Number of Weighted-average contractual intrinsic
shares exercise price life in years value
Options outstanding at March 31, 2006 ................................................. 4,786,900 ¥4,180 4.52
Granted....................................................................................................... 3,176,000 6,140
Exercised .................................................................................................... (1,233,100) 4,008
Canceled .................................................................................................... (437,100) 4,590
Options outstanding at March 31, 2007 ................................................. 6,292,700 5,175 5.53 ¥14,947
Granted....................................................................................................... 3,264,000 7,278
Exercised .................................................................................................... (792,100) 4,208
Canceled .................................................................................................... (423,000) 6,196
Options outstanding at March 31, 2008 ................................................. 8,341,600 6,038 5.71 ¥ 1,753
Granted....................................................................................................... 3,494,000 4,726
Exercised .................................................................................................... (119,900) 3,626
Canceled .................................................................................................... (375,000) 6,889
Options outstanding at March 31, 2009 .................................................
11,340,700 ¥5,631 5.51 ¥ 1
Options exercisable at March 31, 2007 ........................................................ 1,282,700 ¥3,990 2.90 ¥ 4,567
Options exercisable at March 31, 2008 ........................................................ 2,354,600 ¥4,225 2.76 ¥ 1,753
Options exercisable at March 31, 2009 ........................................................
4,971,700 ¥5,302 3.76 ¥ 1
In June 1997, the parent company’s shareholders approved a
stock option plan for board members. In June 2001, the share-
holders approved an amendment of the plan to include both
board members and key employees. Each year, since the plans’
inception, the shareholders have approved the authorization for
the grant of options for the purchase of Toyota’s common stock.
Authorized shares for each year that remain ungranted are
unavailable for grant in future years. Stock options granted in
and after August 2002 have terms ranging from 6 years to 8
years and an exercise price equal to 1.025 times the closing
price of Toyota’s common stock on the date of grant. These
options generally vest 2 years from the date of grant.
On June 23, 2009, at the Ordinary General Shareholders’
Meeting, the shareholders of the parent company approved the
authorization of an additional up to 3,700,000 shares for issuance
under the Toyota’s stock option plan for directors, officers and
employees of the parent company, its subsidiaries and affiliates.
For the years ended March 31, 2007, 2008 and 2009, Toyota
recognized stock-based compensation expenses for stock
options of ¥1,936 million, ¥3,273 million and ¥3,015 million ($31
million) as selling, general and administrative expenses.
The weighted-average grant-date fair value of options grant-
ed during the years ended March 31, 2007, 2008 and 2009 was
¥1,235, ¥1,199, and ¥635 ($6), respectively per share. The fair
value of options granted is amortized over the option vesting
period in determining net income in the consolidated state-
ments of income. The grant-date fair value of options granted is
estimated using the Black-Scholes option pricing model with the
following weighted-average assumptions:
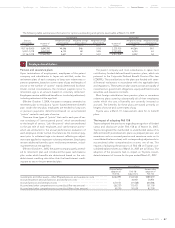
Stock-based compensation:
18
The total intrinsic value of options exercised for the years
ended March 31, 2007, 2008 and 2009 was ¥3,866 million, ¥1,651
million and ¥97 million ($1 million), respectively.
As of March 31, 2009, there were unrecognized compensation
expenses of ¥1,677 million ($17 million) for stock options grant-
ed. Those expenses are expected to be recognized over a
weighted-average period of 1.0 years.
Cash received from the exercise of stock options for the years
ended March 31, 2007, 2008 and 2009 was ¥4,942 million, ¥3,333
million and ¥435 million ($4 million), respectively.