Toyota 2009 Annual Report Download - page 44
Download and view the complete annual report
Please find page 44 of the 2009 Toyota annual report below. You can navigate through the pages in the report by either clicking on the pages listed below, or by using the keyword search tool below to find specific information within the annual report.-
 1
1 -
2
-
3
-
4
-
5
-
6
-
7
-
8
-
9
-
10
-
11
-
12
-
13
-
14
-
15
-
16
-
17
-
18
-
19
-
20
-
21
-
22
-
23
-
24
-
25
-
26
-
27
-
28
-
29
-
30
-
31
-
32
-
33
-
 34
34 -
 35
35 -
 36
36 -
 37
37 -
 38
38 -
 39
39 -
 40
40 -
 41
41 -
 42
42 -
 43
43 -
 44
44 -
 45
45 -
 46
46 -
 47
47 -
 48
48 -
 49
49 -
 50
50 -
 51
51 -
 52
52 -
 53
53 -
 54
54 -
55
-
56
-
57
-
58
-
59
-
60
-
61
-
62
-
63
-
64
-
65
-
66
-
67
-
68
-
69
-
70
-
71
-
72
-
73
-
74
-
75
-
76
-
77
-
78
-
79
-
80
-
81
-
82
-
83
-
84
-
85
-
86
-
87
-
88
-
89
-
90
-
91
-
92
-
93
-
94
-
95
-
96
-
97
-
98
-
99
-
100
-
101
-
102
-
103
-
104
-
105
-
106
-
107
-
108
-
109
-
110
-
111
-
112
 |
 |

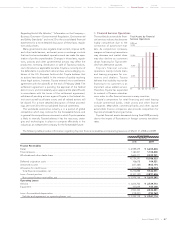
Financial Section
TOYOTA MOTOR CORPORATION
42
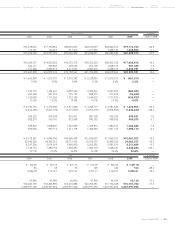
Yen in millions
2000 2001 2002 2003
For the Year:
Net Revenues:
Sales of Products ....................................................... ¥11,892,900 ¥12,402,104 ¥13,499,644 ¥14,793,973
Financing Operations ............................................... 528,349 553,133 690,664 707,580
Total ....................................................................... ¥12,421,249 ¥12,955,237 ¥14,190,308 ¥15,501,553
Costs and Expenses:
Cost of Products Sold ............................................... ¥ 9,839,833 ¥10,218,599 ¥10,874,455 ¥11,914,245
Cost of Financing Operations .................................. 401,998 427,340 459,195 423,885
Selling, General and Administrative ........................ 1,480,857 1,518,569 1,763,026 1,891,777
Total ....................................................................... ¥11,722,688 ¥12,164,508 ¥13,096,676 ¥14,229,907
Operating Income (Loss) .............................................. ¥ 698,561 ¥ 790,729 ¥ 1,093,632 ¥ 1,271,646
% of Net Revenues ................................................... 5.6% 6.1% 7.7% 8.2%
Income (Loss) before Income Taxes,
Minority Interest and Equity in
Earnings of Affiliated Companies .............................. 880,680 1,107,289 972,101 1,226,652
Provision for Income Taxes........................................... 422,731 523,876 422,789 517,014
Net Income (Loss) ......................................................... 481,936 674,898 556,567 750,942
ROE ................................................................................ 7.1% 9.6% 7.8% 10.4%
Net Cash Provided by Operating Activities ............... ¥ 1,098,925 ¥ 1,428,018 ¥ 1,532,079 ¥ 1,940,088
Net Cash Used in Investing Activities ......................... (1,388,517) (1,318,738) (1,810,230) (2,001,448)
Net Cash Provided by (Used in)
Financing Activities ..................................................... 550,267 (166,713) 392,148 37,675
R&D Expenses ............................................................... 451,177 475,716 589,306 668,404
Capital Expenditures for
Property, Plant and Equipment* ................................ 838,309 762,274 940,547 1,005,931
Depreciation .................................................................. 822,315 784,784 809,841 870,636
At Year-End:
Shareholders’ Equity ..................................................... ¥ 6,912,140 ¥ 7,077,411 ¥ 7,264,112 ¥ 7,121,000
Total Assets ................................................................... 16,440,960 17,019,783 19,305,730 20,152,974
Long-Term Debt ............................................................ 2,913,759 3,083,344 3,722,706 4,137,528
Cash and Cash Equivalents .......................................... 1,529,268 1,510,892 1,657,160 1,592,028
Ratio of Shareholders’ Equity ...................................... 42.0% 41.6% 37.6% 35.3%
Yen
2000 2001 2002 2003
Per Share Data:
Net Income (Loss) (Basic) ............................................. ¥ 128.27 ¥ 180.65 ¥ 152.26 ¥ 211.32
Annual Cash Dividends ................................................ 24 25 28 36
Shareholders’ Equity ..................................................... 1,844.02 1,921.29 2,015.82 2,063.43
Stock Information (March 31):
Stock Price ..................................................................... ¥5,370 ¥4,350 ¥3,650 ¥2,635
Market Capitalization (Yen in millions) ........................ ¥20,134,306 ¥16,029,739 ¥13,332,491 ¥9,512,343
Number of Shares Issued (shares) ............................... 3,749,405,129 3,684,997,492 3,649,997,492 3,609,997,492
* Excluding vehicles and equipment of operating leases
Selected Financial Summary (U.S. GAAP)
Toyota Motor Corporation
Fiscal years ended March 31