Toyota 2009 Annual Report Download - page 95
Download and view the complete annual report
Please find page 95 of the 2009 Toyota annual report below. You can navigate through the pages in the report by either clicking on the pages listed below, or by using the keyword search tool below to find specific information within the annual report.-
 1
1 -
2
-
3
-
4
-
5
-
6
-
7
-
8
-
9
-
10
-
11
-
12
-
13
-
14
-
15
-
16
-
17
-
18
-
19
-
20
-
21
-
22
-
23
-
24
-
25
-
26
-
27
-
28
-
29
-
30
-
31
-
32
-
33
-
34
-
35
-
36
-
37
-
38
-
39
-
40
-
41
-
42
-
43
-
44
-
45
-
46
-
47
-
48
-
49
-
50
-
51
-
52
-
53
-
54
-
55
-
56
-
57
-
58
-
59
-
60
-
61
-
62
-
63
-
64
-
65
-
66
-
67
-
68
-
69
-
70
-
71
-
72
-
73
-
74
-
75
-
76
-
77
-
78
-
79
-
80
-
81
-
82
-
83
-
84
-
 85
85 -
 86
86 -
 87
87 -
 88
88 -
 89
89 -
 90
90 -
 91
91 -
 92
92 -
 93
93 -
 94
94 -
 95
95 -
 96
96 -
 97
97 -
 98
98 -
 99
99 -
 100
100 -
 101
101 -
 102
102 -
 103
103 -
 104
104 -
 105
105 -
106
-
107
-
108
-
109
-
110
-
111
-
112
 |
 |

The Right Way Forward Business OverviewPerformance Overview Financial Section
Investor
Information
Management &
Corporate Information
Top Messages
Annual Report 2009 93
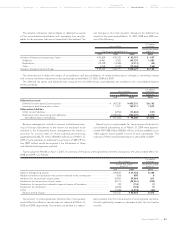
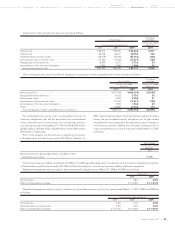
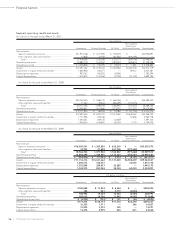
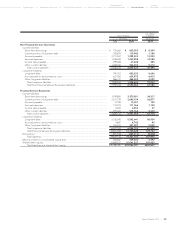
The estimated fair values of Toyota’s financial instruments, excluding marketable securities and other securities investments and affiliated
companies, are summarized as follows:
Yen in millions
March 31, 2008
Carrying Estimated
amount fair value
Asset (Liability)
Cash and cash equivalents .......................................................................................................................................... ¥ 1,628,547 ¥ 1,628,547
Time deposits .............................................................................................................................................................. 134,773 134,773
Total finance receivables, net ..................................................................................................................................... 9,132,242 9,287,490
Other receivables ......................................................................................................................................................... 523,533 523,533
Short-term borrowings ................................................................................................................................................ (3,552,721) (3,552,721)
Long-term debt including the current portion .......................................................................................................... (8,613,799) (8,646,182)
Interest rate and currency swap agreements ............................................................................................................ 223,163 223,163
Foreign exchange forward contracts and option contracts .................................................................................... 40,635 40,635
Yen in millions U.S. dollars in millions
March 31, 2009 March 31, 2009
Carrying Estimated Carrying Estimated
amount fair value amount fair value
Asset (Liability)
Cash and cash equivalents ............................................................................ ¥ 2,444,280 ¥ 2,444,280 $ 24,883 $ 24,883
Time deposits ................................................................................................ 45,178 45,178 460 460
Total finance receivables, net ....................................................................... 8,450,709 8,677,228 86,030 88,336
Other receivables ........................................................................................... 332,722 332,722 3,387 3,387
Short-term borrowings .................................................................................. (3,617,672) (3,617,672) (36,829) (36,829)
Long-term debt including the current portion ............................................ (8,949,615) (9,026,007) (91,109) (91,886)
See note 20 to the consolidated financial statements for the amounts of derivative financial instruments.
Following are explanatory notes regarding the financial assets and liabilities other than derivative financial instruments.
Cash and cash equivalents, time deposits
and other receivables
In the normal course of business, substantially all cash and cash
equivalents, time deposits and other receivables are highly liq-
uid and are carried at amounts which approximate fair value.
Finance receivables, net
The carrying value of variable rate finance receivables was
assumed to approximate fair value as they were repriced at pre-
vailing market rates at March 31, 2008 and 2009. The fair value
of fixed rate finance receivables was estimated by discounting
expected cash flows using the rates at which loans of similar
credit quality and maturity would be made as of March 31, 2008
and 2009.
Short-term borrowings and long-term debt
The fair values of short-term borrowings and total long-term
debt including the current portion were estimated based on the
discounted amounts of future cash flows using Toyota’s current
incremental borrowing rates for similar liabilities.
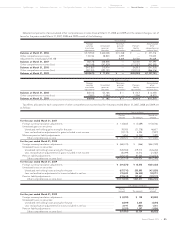
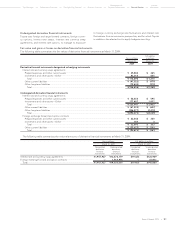
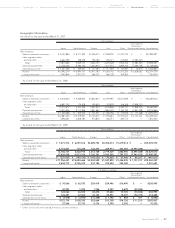
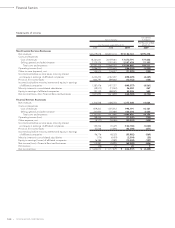
Toyota leases certain assets under capital lease and operating lease arrangements.
An analysis of leased assets under capital leases is as follows:
U.S. dollars
Yen in millions in millions
March 31, March 31,
2008 2009 2009
Class of property
Building...................................................................................................................................... ¥ 11,279 ¥ 24,369 $ 248
Machinery and equipment ....................................................................................................... 136,817 51,971 529
Less—Accumulated depreciation ........................................................................................... (116,019) (33,845) (344)
¥ 32,077 ¥ 42,495 $ 433
Lease commitments:
22