Toyota 2009 Annual Report Download - page 77
Download and view the complete annual report
Please find page 77 of the 2009 Toyota annual report below. You can navigate through the pages in the report by either clicking on the pages listed below, or by using the keyword search tool below to find specific information within the annual report.-
 1
1 -
2
-
3
-
4
-
5
-
6
-
7
-
8
-
9
-
10
-
11
-
12
-
13
-
14
-
15
-
16
-
17
-
18
-
19
-
20
-
21
-
22
-
23
-
24
-
25
-
26
-
27
-
28
-
29
-
30
-
31
-
32
-
33
-
34
-
35
-
36
-
37
-
38
-
39
-
40
-
41
-
42
-
43
-
44
-
45
-
46
-
47
-
48
-
49
-
50
-
51
-
52
-
53
-
54
-
55
-
56
-
57
-
58
-
59
-
60
-
61
-
62
-
63
-
64
-
65
-
66
-
 67
67 -
 68
68 -
 69
69 -
 70
70 -
 71
71 -
 72
72 -
 73
73 -
 74
74 -
 75
75 -
 76
76 -
 77
77 -
 78
78 -
 79
79 -
 80
80 -
 81
81 -
 82
82 -
 83
83 -
 84
84 -
 85
85 -
 86
86 -
 87
87 -
88
-
89
-
90
-
91
-
92
-
93
-
94
-
95
-
96
-
97
-
98
-
99
-
100
-
101
-
102
-
103
-
104
-
105
-
106
-
107
-
108
-
109
-
110
-
111
-
112
 |
 |
The Right Way Forward Business OverviewPerformance Overview Financial Section
Investor
Information
Management &
Corporate Information
Top Messages
Annual Report 2009 75
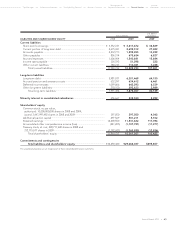
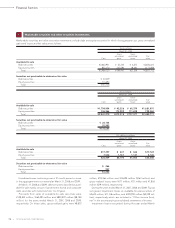
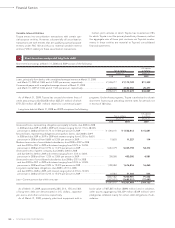
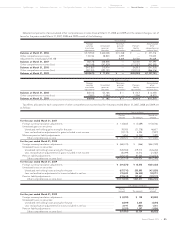
Finance receivables consist of the following:
U.S. dollars
Yen in millions in millions
March 31, March 31,
2008 2009 2009
Retail ................................................................................................................................................. ¥ 6,959,479 ¥ 6,655,404 $ 67,753
Finance leases .................................................................................................................................. 1,160,401 1,108,408 11,284
Wholesale and other dealer loans ................................................................................................. 2,604,411 2,322,721 23,646
10,724,291 10,086,533 102,683
Deferred origination costs .............................................................................................................. 106,678 104,521 1,064
Unearned income ............................................................................................................................ (437,365) (405,171) (4,125)
Allowance for credit losses ............................................................................................................. (117,706) (238,932) (2,432)
Total finance receivables, net .................................................................................................. 10,275,898 9,546,951 97,190
Less—Current portion ..................................................................................................................... (4,301,142) (3,891,406) (39,615)
Noncurrent finance receivables, net ...................................................................................... ¥ 5,974,756 ¥ 5,655,545 $ 57,575
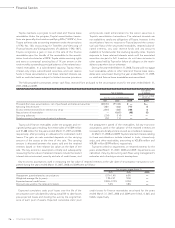
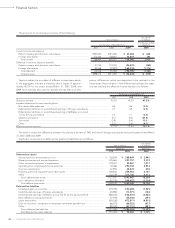
The contractual maturities of retail receivables, the future minimum lease payments on finance leases and wholesale and other dealer
loans at March 31, 2009 are summarized as follows:
Yen in millions U.S. dollars in millions
Wholesale Wholesale
Finance and other Finance and other
Years ending March 31, Retail lease dealer loans Retail lease dealer loans
2010..................................................................... ¥1,925,835 ¥330,433 ¥1,790,174 $19,605 $3,364 $18,224
2011..................................................................... 1,717,107 243,759 127,512 17,480 2,482 1,298
2012..................................................................... 1,367,769 187,929 107,624 13,924 1,913 1,096
2013..................................................................... 900,158 76,534 86,585 9,164 779 881
2014..................................................................... 467,476 23,419 105,055 4,759 238 1,070
Thereafter ........................................................... 277,059 9,176 105,771 2,821 93 1,077
¥6,655,404 ¥871,250 ¥2,322,721 $67,753 $8,869 $23,646
Finance leases consist of the following:
U.S. dollars
Yen in millions in millions
March 31, March 31,
2008 2009 2009
Minimum lease payments ................................................................................................................. ¥ 738,786 ¥ 871,250 $ 8,870
Estimated unguaranteed residual values ........................................................................................ 421,615 237,158 2,414
1,160,401 1,108,408 11,284
Deferred origination costs ................................................................................................................ 4,414 6,085 62
Less—Unearned income ................................................................................................................... (118,831) (102,826) (1,047)
Less—Allowance for credit losses .................................................................................................... (4,592) (7,776) (79)
Finance leases, net ........................................................................................................................ ¥1,041,392 ¥1,003,891 $10,220
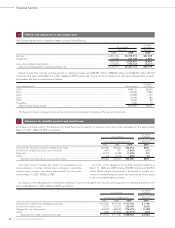
Finance receivables:
7
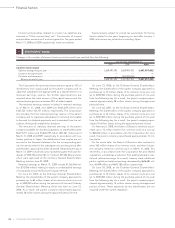
31, 2009 primarily include a loss for an other-than-temporary
impairment on a certain investment for which Toyota previously
recorded an exchange gain in accordance with EITF Issue No.
91-5, Nonmonetary Exchange of Cost-Method Investments.
In the ordinary course of business, Toyota maintains long-term
investment securities, included in “Marketable securities and
other securities investments” and issued by a number of non-
public companies which are recorded at cost, as their fair values
were not readily determinable. Management employs a system-
atic methodology to assess the recoverability of such invest-
ments by reviewing the financial viability of the underlying
companies and the prevailing market conditions in which these
companies operate to determine if Toyota’s investment in each
individual company is impaired and whether the impairment is
other-than-temporary. Toyota periodically performs this impair-
ment test for significant investments recorded at cost. If the
impairment is determined to be other-than-temporary, the car-
rying value of the investment is written-down by the impaired
amount and the losses are recognized currently in operations.