Toyota 2009 Annual Report Download - page 94
Download and view the complete annual report
Please find page 94 of the 2009 Toyota annual report below. You can navigate through the pages in the report by either clicking on the pages listed below, or by using the keyword search tool below to find specific information within the annual report.-
 1
1 -
2
-
3
-
4
-
5
-
6
-
7
-
8
-
9
-
10
-
11
-
12
-
13
-
14
-
15
-
16
-
17
-
18
-
19
-
20
-
21
-
22
-
23
-
24
-
25
-
26
-
27
-
28
-
29
-
30
-
31
-
32
-
33
-
34
-
35
-
36
-
37
-
38
-
39
-
40
-
41
-
42
-
43
-
44
-
45
-
46
-
47
-
48
-
49
-
50
-
51
-
52
-
53
-
54
-
55
-
56
-
57
-
58
-
59
-
60
-
61
-
62
-
63
-
64
-
65
-
66
-
67
-
68
-
69
-
70
-
71
-
72
-
73
-
74
-
75
-
76
-
77
-
78
-
79
-
80
-
81
-
82
-
83
-
 84
84 -
 85
85 -
 86
86 -
 87
87 -
 88
88 -
 89
89 -
 90
90 -
 91
91 -
 92
92 -
 93
93 -
 94
94 -
 95
95 -
 96
96 -
 97
97 -
 98
98 -
 99
99 -
 100
100 -
 101
101 -
 102
102 -
 103
103 -
 104
104 -
105
-
106
-
107
-
108
-
109
-
110
-
111
-
112
 |
 |
Financial Section
TOYOTA MOTOR CORPORATION
92
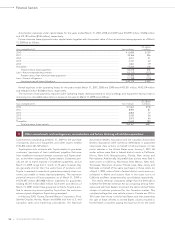
Toyota has certain financial instruments, including financial
assets and liabilities and off-balance sheet financial instruments
which arose in the normal course of business. These financial
instruments are executed with creditworthy financial institutions,
and virtually all foreign currency contracts are denominated in
U.S. dollars, euros and other currencies of major industrialized
countries. Financial instruments involve, to varying degrees, mar-
ket risk as instruments are subject to price fluctuations, and ele-
ments of credit risk in the event a counterparty should default. In
the unlikely event the counterparties fail to meet the contractual
terms of a foreign currency or an interest rate instrument,
Toyota’s risk is limited to the fair value of the instrument.
Although Toyota may be exposed to losses in the event of non-
performance by counterparties on financial instruments, it does
not anticipate significant losses due to the nature of its counter-
parties. Counterparties to Toyota’s financial instruments repre-
sent, in general, international financial institutions. Additionally,
Toyota does not have a significant exposure to any individual
counterparty. Based on the creditworthiness of these financial
institutions, collateral is generally not required of the counterpar-
ties or of Toyota. Toyota believes that the overall credit risk relat-
ed to its financial instruments is not significant.
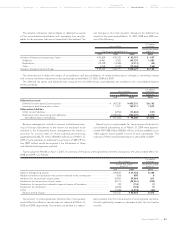
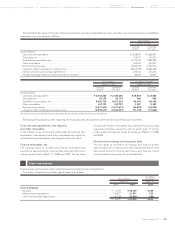
Other financial instruments:
21
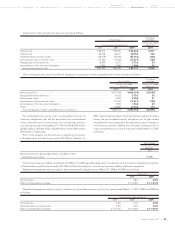
Unrealized gains or (losses) on undesignated derivative finan-
cial instruments reported in the cost of financing operations for
the years ended March 31, 2007, 2008 and 2009 were ¥(19,984)
million, ¥(67,991) million and ¥(80,298) million ($(817) million)
those reported in foreign exchange gain (loss), net were ¥17,866
million, ¥45,670 million and ¥(33,578) million ($(342) million),
respectively.
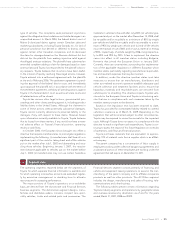
Credit risk related contingent features
Toyota enters into International Swaps and Derivatives
Association Master Agreements with counterparties. These
Master Agreements contain a provision requiring either Toyota
or the counterparty to settle the contract or to post assets to the
other party in the event of a ratings downgrade below a speci-
fied threshold.
The aggregate fair value amount of derivative financial instru-
ments that contain credit risk related contingent features that
are in a net liability position as of March 31, 2009 is ¥136,147 mil-
lion ($1,386 million). The aggregate fair value amount of assets
that are already posted as of March 31, 2009 is ¥28,978 million
($295 million). If the ratings of Toyota decline below specified
thresholds, the maximum amount of assets to be posted or for
which Toyota could be required to settle the contracts is
¥136,147 million ($1,386 million) as of March 31, 2009.
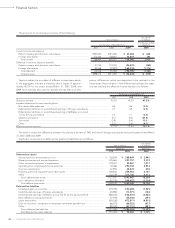
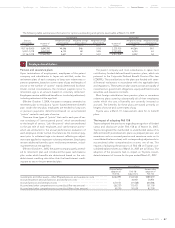
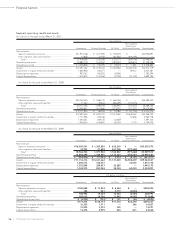
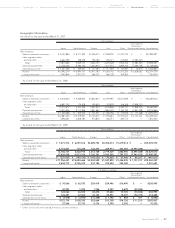
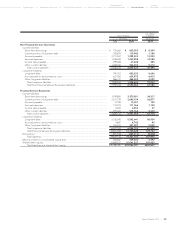
The following table summarizes the gains and losses on derivative financial instruments and hedged items reported in the consolidated
statement of income for the year ended March 31, 2009:
Yen in millions U.S. dollars in millions
For the year ended For the year ended
March 31, 2009 March 31, 2009
Gains or (losses) Gains or (losses)
on derivative Gains or on derivative Gains or
financial (losses) on financial (losses) on
instruments hedged items instruments hedged items
Derivative financial instruments designated as
hedging instruments—Fair value hedge
Interest rate and currency swap agreements
Cost of financing operations ..................................................................... ¥288,553 ¥(293,637) $2,938 $(2,989)
Interest expense ......................................................................................... (439) 439 (4) 4
Undesignated derivative financial instruments
Interest rate and currency swap agreements
Cost of financing operations ..................................................................... ¥ 76,878 ¥ — $ 783 $ —
Foreign exchange gain (loss), net ............................................................. (3,016) — (31) —
Foreign exchange forward and option contracts
Cost of financing operations ..................................................................... 18,327 — 187 —
Foreign exchange gain (loss), net ............................................................. 174,158 — 1,773 —