Toyota 2009 Annual Report Download - page 103
Download and view the complete annual report
Please find page 103 of the 2009 Toyota annual report below. You can navigate through the pages in the report by either clicking on the pages listed below, or by using the keyword search tool below to find specific information within the annual report.-
 1
1 -
2
-
3
-
4
-
5
-
6
-
7
-
8
-
9
-
10
-
11
-
12
-
13
-
14
-
15
-
16
-
17
-
18
-
19
-
20
-
21
-
22
-
23
-
24
-
25
-
26
-
27
-
28
-
29
-
30
-
31
-
32
-
33
-
34
-
35
-
36
-
37
-
38
-
39
-
40
-
41
-
42
-
43
-
44
-
45
-
46
-
47
-
48
-
49
-
50
-
51
-
52
-
53
-
54
-
55
-
56
-
57
-
58
-
59
-
60
-
61
-
62
-
63
-
64
-
65
-
66
-
67
-
68
-
69
-
70
-
71
-
72
-
73
-
74
-
75
-
76
-
77
-
78
-
79
-
80
-
81
-
82
-
83
-
84
-
85
-
86
-
87
-
88
-
89
-
90
-
91
-
92
-
 93
93 -
 94
94 -
 95
95 -
 96
96 -
 97
97 -
 98
98 -
 99
99 -
 100
100 -
 101
101 -
 102
102 -
 103
103 -
 104
104 -
 105
105 -
 106
106 -
 107
107 -
 108
108 -
 109
109 -
 110
110 -
 111
111 -
 112
112
 |
 |

The Right Way Forward Business OverviewPerformance Overview Financial Section
Investor
Information
Management &
Corporate Information
Top Messages
Annual Report 2009 101
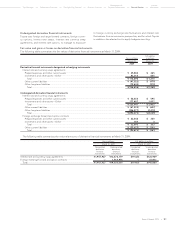
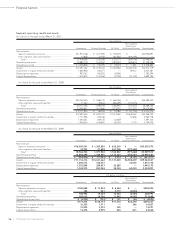
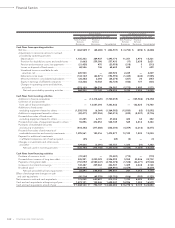
Statements of cash fl ows
Yen in millions Yen in millions
For the year ended March 31, 2007 For the year ended March 31, 2008
Non-Financial Financial Non-Financial Financial
Services Services Services Services
Businesses Businesses Consolidated Businesses Businesses Consolidated
Cash flows from operating activities
Net income ....................................................................... ¥ 1,531,093 ¥ 112,987 ¥ 1,644,032 ¥ 1,671,859 ¥ 45,995 ¥ 1,717,879
Adjustments to reconcile net income to net cash
provided by operating activities
Depreciation ................................................................. 979,718 402,876 1,382,594 1,081,410 409,725 1,491,135
Provision for doubtful accounts and credit losses .... (841) 72,703 71,862 357 122,433 122,790
Pension and severance costs, less payments ............ (33,319) 1,265 (32,054) (54,868) 527 (54,341)
Losses on disposal of fixed assets .............................. 49,193 1,279 50,472 44,993 444 45,437
Unrealized losses on available-for-sale
securities, net ............................................................. 4,614 — 4,614 11,346 — 11,346
Deferred income taxes ................................................ 42,698 89,643 132,308 80,027 1,500 81,458
Minority interest in consolidated subsidiaries ........... 49,513 174 49,687 73,543 4,419 77,962
Equity in earnings of affiliated companies ................. (193,130) (16,385) (209,515) (268,025) (2,089) (270,114)
Changes in operating assets and liabilities,
and other .................................................................... 182,548 125,700 144,173 (220,217) 215,218 (241,928)
Net cash provided by operating activities ............. 2,612,087 790,242 3,238,173 2,420,425 798,172 2,981,624
Cash flows from investing activities
Additions to finance receivables .................................... — (14,192,154) (7,489,096) — (16,644,139) (8,647,717)
Collection of and proceeds
from sale of finance receivables ................................... — 12,814,669 6,274,744 — 15,095,380 7,332,697
Additions to fixed assets
excluding equipment leased to others ........................ (1,414,468) (11,346) (1,425,814) (1,472,422) (8,148) (1,480,570)
Additions to equipment leased to others ..................... (153,163) (1,111,218) (1,264,381) (137,711) (1,141,694) (1,279,405)
Proceeds from sales of fixed assets
excluding equipment leased to others ........................ 56,040 8,381 64,421 56,603 10,948 67,551
Proceeds from sales of equipment leased to others .... 107,270 214,491 321,761 80,944 294,937 375,881
Purchases of marketable securities
and security investments ............................................... (889,008) (179,197) (1,068,205) (936,324) (215,316) (1,151,640)
Proceeds from sales of and maturity of
marketable securities and security investments .......... 708,130 117,041 825,171 789,366 198,044 987,410
Payment for additional investments
in affiliated companies, net of cash acquired .............. (1,651) — (1,651) (4,406) — (4,406)
Changes in investments and other assets,
and other ........................................................................ (21,751) 15,250 (51,328) (44,891) 23,024 (74,687)
Net cash used in investing activities ....................... (1,608,601) (2,324,083) (3,814,378) (1,668,841) (2,386,964) (3,874,886)
Cash flows from financing activities
Purchase of common stock ............................................. (295,699) — (295,699) (311,667) — (311,667)
Proceeds from issuance of long-term debt ................... 31,509 2,897,028 2,890,000 17,162 3,364,351 3,349,812
Payments of long-term debt ........................................... (41,833) (1,694,407) (1,726,823) (226,561) (2,156,709) (2,310,008)
Increase (decrease) in short-term borrowings ............... (83,651) 362,078 353,397 24,126 370,293 408,912
Dividends
paid ................................................................. (339,107) — (339,107) (430,860) — (430,860)
Net cash provided by (used in)
financing activities .................................................. (728,781) 1,564,699 881,768 (927,800) 1,577,935 706,189
Effect of exchange rate changes on cash
and cash equivalents ......................................................... 21,995 3,434 25,429 (65,405) (19,354) (84,759)
Net increase (decrease) in cash and cash equivalents ..... 296,700 34,292 330,992 (241,621) (30,211) (271,832)
Cash and cash equivalents at beginning of year .............. 1,418,022 151,365 1,569,387 1,714,722 185,657 1,900,379
Cash and cash equivalents at end of year ......................... ¥ 1,714,722 ¥ 185,657 ¥ 1,900,379 ¥ 1,473,101 ¥ 155,446 ¥ 1,628,547