Toyota 2009 Annual Report Download - page 66
Download and view the complete annual report
Please find page 66 of the 2009 Toyota annual report below. You can navigate through the pages in the report by either clicking on the pages listed below, or by using the keyword search tool below to find specific information within the annual report.-
 1
1 -
2
-
3
-
4
-
5
-
6
-
7
-
8
-
9
-
10
-
11
-
12
-
13
-
14
-
15
-
16
-
17
-
18
-
19
-
20
-
21
-
22
-
23
-
24
-
25
-
26
-
27
-
28
-
29
-
30
-
31
-
32
-
33
-
34
-
35
-
36
-
37
-
38
-
39
-
40
-
41
-
42
-
43
-
44
-
45
-
46
-
47
-
48
-
49
-
50
-
51
-
52
-
53
-
54
-
55
-
 56
56 -
 57
57 -
 58
58 -
 59
59 -
 60
60 -
 61
61 -
 62
62 -
 63
63 -
 64
64 -
 65
65 -
 66
66 -
 67
67 -
 68
68 -
 69
69 -
 70
70 -
 71
71 -
 72
72 -
 73
73 -
 74
74 -
 75
75 -
 76
76 -
77
-
78
-
79
-
80
-
81
-
82
-
83
-
84
-
85
-
86
-
87
-
88
-
89
-
90
-
91
-
92
-
93
-
94
-
95
-
96
-
97
-
98
-
99
-
100
-
101
-
102
-
103
-
104
-
105
-
106
-
107
-
108
-
109
-
110
-
111
-
112
 |
 |

Financial Section
TOYOTA MOTOR CORPORATION
64
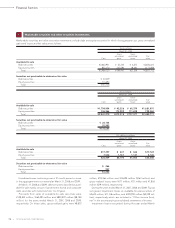
U.S. dollars
Yen in millions in millions
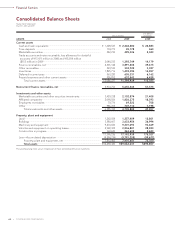
ASSETS 2008 2009 2009
Current assets
Cash and cash equivalents ............................................................................... ¥ 1,628,547 ¥ 2,444,280 $ 24,883
Time deposits
.................................................................................................. 134,773 45,178 460
Marketable securities ....................................................................................... 542,210 495,326 5,043
Trade accounts and notes receivable, less allowance for doubtful
accounts of ¥17,471 million in 2008 and ¥15,034 million
($153 million) in 2009 ...................................................................................... 2,040,233 1,392,749 14,179
Finance receivables, net ................................................................................... 4,301,142 3,891,406 39,615
Other receivables .............................................................................................. 523,533 332,722 3,387
Inventories ......................................................................................................... 1,825,716 1,459,394 14,857
Deferred income taxes ..................................................................................... 563,220 605,331 6,162
Prepaid expenses and other current assets.................................................... 526,853 632,543 6,439
Total current assets ................................................................................... 12,086,227 11,298,929 115,025
Noncurrent finance receivables, net ................................................................ 5,974,756 5,655,545 57,575
Investments and other assets
Marketable securities and other securities investments ............................... 3,429,238 2,102,874 21,408
Affiliated companies ......................................................................................... 2,098,556 1,826,375 18,593
Employees receivables ..................................................................................... 70,776 69,523 708
Other .................................................................................................................. 986,765 707,110 7,198
Total investments and other assets ......................................................... 6,585,335 4,705,882 47,907
Property, plant and equipment
Land ................................................................................................................... 1,262,034 1,257,409 12,801
Buildings ............................................................................................................ 3,580,607 3,633,954 36,994
Machinery and equipment ............................................................................... 9,270,650 9,201,093 93,669
Vehicles and equipment on operating leases ................................................ 2,922,325 2,836,881 28,880
Construction in progress .................................................................................. 360,620 263,602 2,683
17,396,236 17,192,939 175,027
Less—Accumulated depreciation ................................................................... (9,584,234) (9,791,258) (99,677)
Property, plant and equipment, net ........................................................ 7,812,002 7,401,681 75,350
Total assets ............................................................................................... ¥32,458,320 ¥29,062,037 $295,857
The accompanying notes are an integral part of these consolidated financial statements.
Consolidated Balance Sheets
Toyota Motor Corporation
March 31, 2008 and 2009