Toyota 2009 Annual Report Download - page 81
Download and view the complete annual report
Please find page 81 of the 2009 Toyota annual report below. You can navigate through the pages in the report by either clicking on the pages listed below, or by using the keyword search tool below to find specific information within the annual report.-
 1
1 -
2
-
3
-
4
-
5
-
6
-
7
-
8
-
9
-
10
-
11
-
12
-
13
-
14
-
15
-
16
-
17
-
18
-
19
-
20
-
21
-
22
-
23
-
24
-
25
-
26
-
27
-
28
-
29
-
30
-
31
-
32
-
33
-
34
-
35
-
36
-
37
-
38
-
39
-
40
-
41
-
42
-
43
-
44
-
45
-
46
-
47
-
48
-
49
-
50
-
51
-
52
-
53
-
54
-
55
-
56
-
57
-
58
-
59
-
60
-
61
-
62
-
63
-
64
-
65
-
66
-
67
-
68
-
69
-
70
-
 71
71 -
 72
72 -
 73
73 -
 74
74 -
 75
75 -
 76
76 -
 77
77 -
 78
78 -
 79
79 -
 80
80 -
 81
81 -
 82
82 -
 83
83 -
 84
84 -
 85
85 -
 86
86 -
 87
87 -
 88
88 -
 89
89 -
 90
90 -
 91
91 -
92
-
93
-
94
-
95
-
96
-
97
-
98
-
99
-
100
-
101
-
102
-
103
-
104
-
105
-
106
-
107
-
108
-
109
-
110
-
111
-
112
 |
 |
The Right Way Forward Business OverviewPerformance Overview Financial Section
Investor
Information
Management &
Corporate Information
Top Messages
Annual Report 2009 79
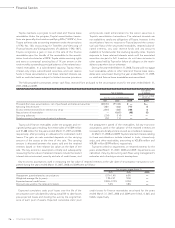
Entities comprising a significant portion of Toyota’s invest-
ment in affiliated companies include Denso Corporation; Aioi
Insurance Co., Ltd.; Aisin Seiki Co., Ltd.; Toyota Industries
Corporation; and Toyota Tsusho Corporation.
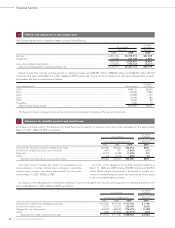
Certain affiliated companies accounted for by the equity
method with carrying amounts of ¥1,677,617 million and
¥1,417,896 million ($14,434 million) at March 31, 2008 and 2009,
respectively, were quoted on various established markets at an
aggregate value of ¥2,229,321 million and ¥1,127,976 million
($11,483 million), respectively. For the year ended March 31,
2009, Toyota did not recognize impairment losses on certain
investments in affiliated companies accounted for by the equity
method after considering the length of time and the extent to
which the quoted market prices have been less than the carry-
ing amounts, the financial condition and near-term prospects of
the affiliated companies and Toyota’s ability and intent to retain
those investments in the companies for a period of time.
The other amount primarily includes the impact of currency translation adjustments for the years ended March 31, 2007, 2008 and 2009.
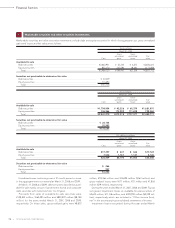
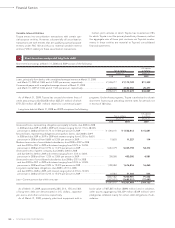
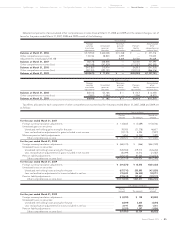
Investments in and transactions with affi liated companies
Summarized financial information for affiliated companies accounted for by the equity method is shown below:
U.S. dollars
Yen in millions in millions
March 31, March 31,
2008 2009 2009
Current assets .............................................................................................................................. ¥ 8,067,295 ¥ 6,400,685 $ 65,160
Noncurrent assets ........................................................................................................................ 10,689,963 9,438,905 96,090
Total assets ........................................................................................................................... ¥18,757,258 ¥15,839,590 $161,250
Current liabilities .......................................................................................................................... ¥ 6,012,270 ¥ 4,216,956 $ 42,929
Long-term liabilities ..................................................................................................................... 5,619,997 5,740,150 58,436
Shareholders’ equity .................................................................................................................... 7,124,991 5,882,484 59,885
Total liabilities and shareholders’ equity ............................................................................ ¥18,757,258 ¥15,839,590 $161,250
Toyota’s share of shareholders’ equity ....................................................................................... ¥ 2,065,778 ¥ 1,810,106 $ 18,427
Number of affiliated companies accounted for by the equity method at end of period ..... 55 56
U.S. dollars
Yen in millions in millions
For the year ended
For the years ended March 31, March 31,
2007 2008 2009 2009
Net revenues ..................................................................................................... ¥23,368,250 ¥26,511,831 ¥23,149,968 $235,671
Gross profit ........................................................................................................ ¥ 2,642,377 ¥ 3,081,366 ¥ 2,034,617 $ 20,713
Net income........................................................................................................ ¥ 701,816 ¥ 870,528 ¥ 13,838 $ 141
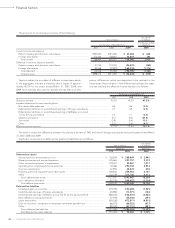
Account balances and transactions with affiliated companies are presented below:
U.S. dollars
Yen in millions in millions
March 31, March 31,
2008 2009 2009
Trade accounts and notes receivable, and other receivables ........................................................ ¥247,311 ¥159,821 $1,627
Accounts payable and other payables ............................................................................................ 622,830 363,954 3,705
U.S. dollars
Yen in millions in millions
For the year ended
For the years ended March 31, March 31,
2007 2008 2009 2009
Net revenues ....................................................................................................... ¥1,475,220 ¥1,693,969 ¥1,585,814 $16,144
Purchases ............................................................................................................. 4,028,260 4,525,049 3,918,717 39,893
Affiliated companies and variable interest entities:
12
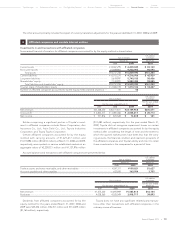
Dividends from affiliated companies accounted for by the
equity method for the years ended March 31, 2007, 2008 and
2009 were ¥45,234 million, ¥76,351 million and ¥114,409 million
($1,165 million), respectively.
Toyota does not have any significant related party transac-
tions other than transactions with affiliated companies in the
ordinary course of business.