Toyota 2009 Annual Report Download - page 65
Download and view the complete annual report
Please find page 65 of the 2009 Toyota annual report below. You can navigate through the pages in the report by either clicking on the pages listed below, or by using the keyword search tool below to find specific information within the annual report.-
 1
1 -
2
-
3
-
4
-
5
-
6
-
7
-
8
-
9
-
10
-
11
-
12
-
13
-
14
-
15
-
16
-
17
-
18
-
19
-
20
-
21
-
22
-
23
-
24
-
25
-
26
-
27
-
28
-
29
-
30
-
31
-
32
-
33
-
34
-
35
-
36
-
37
-
38
-
39
-
40
-
41
-
42
-
43
-
44
-
45
-
46
-
47
-
48
-
49
-
50
-
51
-
52
-
53
-
54
-
 55
55 -
 56
56 -
 57
57 -
 58
58 -
 59
59 -
 60
60 -
 61
61 -
 62
62 -
 63
63 -
 64
64 -
 65
65 -
 66
66 -
 67
67 -
 68
68 -
 69
69 -
 70
70 -
 71
71 -
 72
72 -
 73
73 -
 74
74 -
 75
75 -
76
-
77
-
78
-
79
-
80
-
81
-
82
-
83
-
84
-
85
-
86
-
87
-
88
-
89
-
90
-
91
-
92
-
93
-
94
-
95
-
96
-
97
-
98
-
99
-
100
-
101
-
102
-
103
-
104
-
105
-
106
-
107
-
108
-
109
-
110
-
111
-
112
 |
 |

The Right Way Forward Business OverviewPerformance Overview Financial Section
Investor
Information
Management &
Corporate Information
Top Messages
Annual Report 2009 63
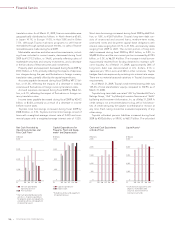
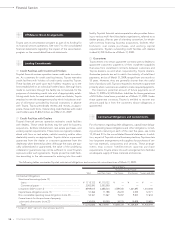
Interest Rate Risk
Toyota is subject to market risk from exposures to changes in
interest rates based on its financing, investing and cash man-
agement activities. Toyota enters into various financial instru-
ment transactions to maintain the desired level of exposure to
the risk of interest rate fluctuations and to minimize interest
expense. The potential decrease in fair value resulting from a
hypothetical 100 basis point upward shift in interest rates would
be approximately ¥110.6 billion as of March 31, 2008 and ¥55.8
billion as of March 31, 2009.
There are certain shortcomings inherent to the sensitivity
analyses presented. The model assumes that interest rate
changes are instantaneous parallel shifts in the yield curve.
However, in reality, changes are rarely instantaneous. Although
certain assets and liabilities may have similar maturities or peri-
ods to repricing, they may not react correspondingly to changes
in market interest rates. Also, the interest rates on certain types
of assets and liabilities may fluctuate with changes in market
interest rates, while interest rates on other types of assets may
lag behind changes in market rates. Finance receivables are less
susceptible to prepayments when interest rates change and, as
a result, Toyota’s model does not address prepayment risk for
automotive related finance receivables. However, in the event of
a change in interest rates, actual loan prepayments may deviate
significantly from the assumptions used in the model.
Commodity Price Risk
Commodity price risk is the possibility of higher or lower costs
due to changes in the prices of commodities, such as non-
ferrous alloys (e.g., aluminum), precious metals (e.g., palladium,
platinum and rhodium) and ferrous alloys, which Toyota uses in
the production of motor vehicles. Toyota does not use deriva-
tive instruments to hedge the price risk associated with the pur-
chase of those commodities and controls its commodity price
risk by holding minimum stock levels.
Equity Price Risk
Toyota holds investments in various available-for-sale equity
securities that are subject to price risk. The fair value of avail-
able-for-sale equity securities was ¥1,177.0 billion as of March
31, 2008 and ¥798.2 billion as of March 31, 2009. The potential
change in the fair value of these investments, assuming a 10%
change in prices, would be approximately ¥117.7 billion as of
March 31, 2008 and ¥79.8 billion as of March 31, 2009.