Toyota 2009 Annual Report Download - page 98
Download and view the complete annual report
Please find page 98 of the 2009 Toyota annual report below. You can navigate through the pages in the report by either clicking on the pages listed below, or by using the keyword search tool below to find specific information within the annual report.-
 1
1 -
2
-
3
-
4
-
5
-
6
-
7
-
8
-
9
-
10
-
11
-
12
-
13
-
14
-
15
-
16
-
17
-
18
-
19
-
20
-
21
-
22
-
23
-
24
-
25
-
26
-
27
-
28
-
29
-
30
-
31
-
32
-
33
-
34
-
35
-
36
-
37
-
38
-
39
-
40
-
41
-
42
-
43
-
44
-
45
-
46
-
47
-
48
-
49
-
50
-
51
-
52
-
53
-
54
-
55
-
56
-
57
-
58
-
59
-
60
-
61
-
62
-
63
-
64
-
65
-
66
-
67
-
68
-
69
-
70
-
71
-
72
-
73
-
74
-
75
-
76
-
77
-
78
-
79
-
80
-
81
-
82
-
83
-
84
-
85
-
86
-
87
-
 88
88 -
 89
89 -
 90
90 -
 91
91 -
 92
92 -
 93
93 -
 94
94 -
 95
95 -
 96
96 -
 97
97 -
 98
98 -
 99
99 -
 100
100 -
 101
101 -
 102
102 -
 103
103 -
 104
104 -
 105
105 -
 106
106 -
 107
107 -
 108
108 -
109
-
110
-
111
-
112
 |
 |

Financial Section
TOYOTA MOTOR CORPORATION
96
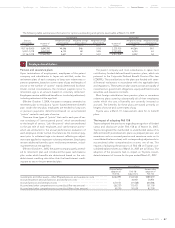
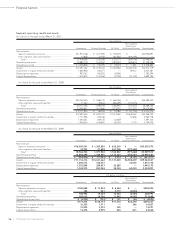
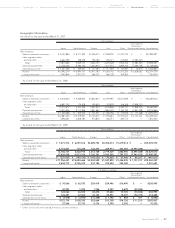
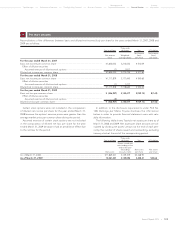
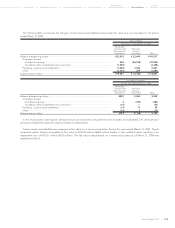
Segment operating results and assets
As of and for the year ended March 31, 2007:
Yen in millions
Inter-segment
Elimination/
Automotive Financial Services All Other Unallocated Amount Consolidated
Net revenues
Sales to external customers ............................................. ¥21,914,168 ¥ 1,277,994 ¥ 755,929 ¥ — ¥23,948,091
Inter-segment sales and transfers ................................... 13,838 22,554 567,802 (604,194) —
Total ................................................................................ 21,928,006 1,300,548 1,323,731 (604,194) 23,948,091
Operating expenses ............................................................. 19,889,178 1,142,053 1,284,052 (605,875) 21,709,408
Operating income ................................................................ ¥ 2,038,828 ¥ 158,495 ¥ 39,679 ¥ 1,681 ¥ 2,238,683
Assets ..................................................................................... ¥13,297,362 ¥13,735,434 ¥1,459,965 ¥4,082,018 ¥32,574,779
Investment in equity method investees .............................. 1,664,938 303,271 — 59,072 2,027,281
Depreciation expenses ........................................................ 950,762 402,876 28,956 — 1,382,594
Capital Expenditure .............................................................. 1,570,875 1,122,564 47,948 (51,192) 2,690,195
As of and for the year ended March 31, 2008:
Yen in millions
Inter-segment
Elimination/
Automotive Financial Services All Other Unallocated Amount Consolidated
Net revenues
Sales to external customers ............................................. ¥24,160,254 ¥ 1,468,730 ¥ 660,256 ¥ — ¥26,289,240
Inter-segment sales and transfers ................................... 17,052 29,624 686,699 (733,375) —
Total ................................................................................ 24,177,306 1,498,354 1,346,955 (733,375) 26,289,240
Operating expenses ............................................................. 22,005,401 1,411,860 1,313,875 (712,271) 24,018,865
Operating income ................................................................ ¥ 2,171,905 ¥ 86,494 ¥ 33,080 ¥ (21,104) ¥ 2,270,375
Assets ..................................................................................... ¥13,593,025 ¥13,942,372 ¥1,273,560 ¥3,649,363 ¥32,458,320
Investment in equity method investees .............................. 1,777,956 235,166 — 52,656 2,065,778
Depreciation expenses ........................................................ 1,050,541 409,725 30,869 — 1,491,135
Capital expenditure .............................................................. 1,546,524 1,149,842 56,439 7,170 2,759,975
As of and for the year ended March 31, 2009:
Yen in millions
Inter-segment
Elimination/
Automotive Financial Services All Other Unallocated Amount Consolidated
Net revenues
Sales to external customers ............................................. ¥18,550,501 ¥ 1,355,850 ¥ 623,219 ¥ — ¥20,529,570
Inter-segment sales and transfers ................................... 14,222 21,698 561,728 (597,648) —
Total ................................................................................ 18,564,723 1,377,548 1,184,947 (597,648) 20,529,570
Operating expenses ............................................................. 18,959,599 1,449,495 1,175,034 (593,547) 20,990,581
Operating income (loss) ....................................................... ¥ (394,876) ¥ (71,947) ¥ 9,913 ¥ (4,101) ¥ (461,011)
Assets ..................................................................................... ¥11,716,316 ¥13,631,662 ¥1,131,400 ¥2,582,659 ¥29,062,037
Investment in equity method investees .............................. 1,606,013 168,057 — 36,036 1,810,106
Depreciation expenses ........................................................ 1,072,848 389,937 32,385 — 1,495,170
Capital expenditure .............................................................. 1,343,572 883,968 35,334 62,023 2,324,897
U.S. dollars in millions
Inter-segment
Elimination/
Automotive Financial Services All Other Unallocated Amount Consolidated
Net revenues
Sales to external customers ............................................. $188,848 $ 13,803 $ 6,344 $ — $208,995
Inter-segment sales and transfers ................................... 144 221 5,719 (6,084) —
Total ................................................................................ 188,992 14,024 12,063 (6,084) 208,995
Operating expenses ............................................................. 193,012 14,756 11,962 (6,042) 213,688
Operating income (loss) ....................................................... $ (4,020) $ (732) $ 101 $ (42) $ (4,693)
Assets ..................................................................................... $119,274 $138,773 $11,518 $26,292 $295,857
Investment in equity method investees .............................. 16,350 1,711 — 366 18,427
Depreciation expenses ........................................................ 10,922 3,970 329 — 15,221
Capital expenditure .............................................................. 13,678 8,999 360 631 23,668