Toyota 2009 Annual Report Download - page 68
Download and view the complete annual report
Please find page 68 of the 2009 Toyota annual report below. You can navigate through the pages in the report by either clicking on the pages listed below, or by using the keyword search tool below to find specific information within the annual report.-
 1
1 -
2
-
3
-
4
-
5
-
6
-
7
-
8
-
9
-
10
-
11
-
12
-
13
-
14
-
15
-
16
-
17
-
18
-
19
-
20
-
21
-
22
-
23
-
24
-
25
-
26
-
27
-
28
-
29
-
30
-
31
-
32
-
33
-
34
-
35
-
36
-
37
-
38
-
39
-
40
-
41
-
42
-
43
-
44
-
45
-
46
-
47
-
48
-
49
-
50
-
51
-
52
-
53
-
54
-
55
-
56
-
57
-
 58
58 -
 59
59 -
 60
60 -
 61
61 -
 62
62 -
 63
63 -
 64
64 -
 65
65 -
 66
66 -
 67
67 -
 68
68 -
 69
69 -
 70
70 -
 71
71 -
 72
72 -
 73
73 -
 74
74 -
 75
75 -
 76
76 -
 77
77 -
 78
78 -
79
-
80
-
81
-
82
-
83
-
84
-
85
-
86
-
87
-
88
-
89
-
90
-
91
-
92
-
93
-
94
-
95
-
96
-
97
-
98
-
99
-
100
-
101
-
102
-
103
-
104
-
105
-
106
-
107
-
108
-
109
-
110
-
111
-
112
 |
 |

Financial Section
TOYOTA MOTOR CORPORATION
66
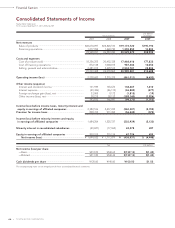
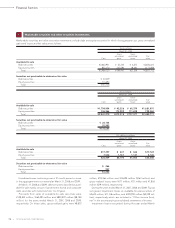
Consolidated Statements of Income
U.S. dollars
Yen in millions in millions
2007 2008 2009 2009
Net revenues
Sales of products .................................................................... ¥22,670,097 ¥24,820,510 ¥19,173,720 $195,192
Financing operations .............................................................. 1,277,994 1,468,730 1,355,850 13,803
23,948,091 26,289,240 20,529,570 208,995
Costs and expenses
Cost of products sold ............................................................. 18,356,255 20,452,338 17,468,416 177,832
Cost of financing operations ................................................. 872,138 1,068,015 987,384 10,052
Selling, general and administrative ....................................... 2,481,015 2,498,512 2,534,781 25,804
21,709,408 24,018,865 20,990,581 213,688
Operating income (loss) ........................................................... 2,238,683 2,270,375 (461,011) (4,693)
Other income (expense)
Interest and dividend income ................................................ 131,939 165,676 138,467 1,410
Interest expense ..................................................................... (49,326) (46,113) (46,882) (477)
Foreign exchange gain (loss), net ......................................... 33,005 9,172 (1,815) (19)
Other income (loss), net ......................................................... 28,215 38,112 (189,140) (1,926)
143,833 166,847 (99,370) (1,012)
Income (loss) before income taxes, minority interest and
equity in earnings of affiliated companies ......................... 2,382,516 2,437,222 (560,381) (5,705)
Provision for income taxes ...................................................... 898,312 911,495 (56,442) (575)
Income (loss) before minority interest and equity
in earnings of affiliated companies ...................................... 1,484,204 1,525,727 (503,939) (5,130)
Minority interest in consolidated subsidiaries ..................... (49,687) (77,962) 24,278 247
Equity in earnings of affiliated companies ........................... 209,515 270,114 42,724 435
Net income (loss) ............................................................... ¥ 1,644,032 ¥ 1,717,879 ¥ (436,937) $ (4,448)
Yen U.S. dollars
Net income (loss) per share
—Basic ..................................................................................... ¥512.09 ¥540.65 ¥(139.13) $(1.42)
—Diluted ................................................................................. ¥511.80 ¥540.44 ¥(139.13) $(1.42)
Cash dividends per share ........................................................ ¥120.00 ¥140.00 ¥100.00 $1.02
The accompanying notes are an integral part of these consolidated financial statements.
Toyota Motor Corporation
For the years ended March 31, 2007, 2008 and 2009