Toyota 2009 Annual Report Download - page 55
Download and view the complete annual report
Please find page 55 of the 2009 Toyota annual report below. You can navigate through the pages in the report by either clicking on the pages listed below, or by using the keyword search tool below to find specific information within the annual report.-
 1
1 -
2
-
3
-
4
-
5
-
6
-
7
-
8
-
9
-
10
-
11
-
12
-
13
-
14
-
15
-
16
-
17
-
18
-
19
-
20
-
21
-
22
-
23
-
24
-
25
-
26
-
27
-
28
-
29
-
30
-
31
-
32
-
33
-
34
-
35
-
36
-
37
-
38
-
39
-
40
-
41
-
42
-
43
-
44
-
 45
45 -
 46
46 -
 47
47 -
 48
48 -
 49
49 -
 50
50 -
 51
51 -
 52
52 -
 53
53 -
 54
54 -
 55
55 -
 56
56 -
 57
57 -
 58
58 -
 59
59 -
 60
60 -
 61
61 -
 62
62 -
 63
63 -
 64
64 -
 65
65 -
66
-
67
-
68
-
69
-
70
-
71
-
72
-
73
-
74
-
75
-
76
-
77
-
78
-
79
-
80
-
81
-
82
-
83
-
84
-
85
-
86
-
87
-
88
-
89
-
90
-
91
-
92
-
93
-
94
-
95
-
96
-
97
-
98
-
99
-
100
-
101
-
102
-
103
-
104
-
105
-
106
-
107
-
108
-
109
-
110
-
111
-
112
 |
 |

The Right Way Forward Business OverviewPerformance Overview Financial Section
Investor
Information
Management &
Corporate Information
Top Messages
Annual Report 2009 53
prior year. The increase resulted primarily from the approximate
¥1,300 billion impact on costs of products attributed to vehicle
unit sales growth and changes in sales mix, the ¥252.1 billion
impact of fluctuations in foreign currency translation rates, the
¥68.1 billion increase in research and development expenses,
increased expenses in expanding business operations and
increased costs corresponding to the increase in parts sales.
These increases were partially offset by the approximate ¥120
billion impact attributed to the net impact of cost reduction
efforts, responding to the rise in prices of production materials
and parts in fiscal 2008.
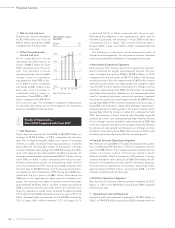
Continued cost reduction efforts reduced operating costs and
expenses in fiscal 2008 by approximately ¥120 billion, partially
offset by increases in the prices of steel, precious metals, non-
ferrous alloys including aluminum, plastic parts and other pro-
duction materials and parts, over what would have otherwise
been incurred. These cost reduction efforts relate to ongoing
value engineering and value analysis activities, the use of com-
mon parts that result in a reduction of part types and other
manufacturing initiatives designed to reduce the costs of vehicle
production.
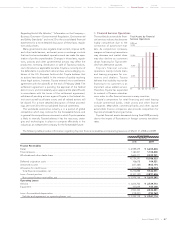
Cost of products sold increased by ¥2,096.1 billion, or 11.4%,
to ¥20,452.4 billion during fiscal 2008 compared with the prior
year. This increase (before the elimination of intersegment
amounts) reflects an increase of ¥2,107.7 billion, or 11.9%, for
the automotive operations and an increase of ¥33.4 billion, or
2.9%, for all other operations segment. The increase in cost of
products sold for automotive operations is primarily attributed
to the increased vehicle unit sales and changes in sales mix, the
impact of the increase in parts sales, the impact of the increase
in research and development expenses and the impact of fluc-
tuations in foreign currency translation rates during fiscal 2008,
which were partially offset by the impact of continued cost reduc-
tion efforts. The increase in cost of products sold for all other
operations primarily related to the increase in net revenues.
Cost of financing operations increased by ¥195.9 billion, or
22.5%, to ¥1,068.0 billion during fiscal 2008 compared with the
prior year. The increase resulted primarily from the impact of
increased interest expenses caused primarily by an increase in
borrowings attributed to business expansion. The increase is
also attributed to the impact of losses due to changes in the fair
value of derivative financial instruments that are not designated
as hedges and are marked-to-market at the end of each period.
Selling, general and administrative expenses increased by
¥17.5 billion, or 0.7%, to ¥2,498.5 billion during fiscal 2008 com-
pared with the prior year. This increase mainly reflects an
increase for the financial services operations. The increase for
the financial services operations is primarily attributed to the
impact of increased expenses.
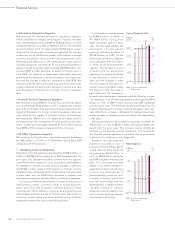
Research and development expenses (included in cost of
products sold and selling, general and administrative expens-
es) increased by ¥68.1 billion, or 7.6%, to ¥958.8 billion during
fiscal 2008 compared with the prior year. This increase primarily
relates to expenditures attributed to the development of envi-
ronmentally conscious technologies including hybrid and fuel-
cell technology, aggressive developments in advanced
technologies relating to collision safety and vehicle stability con-
trols and the impact of expanding new models to promote
Toyota’s strength in a global market to further build up competi-
tive strength in the future.
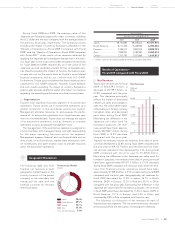
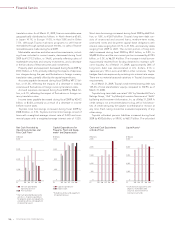
Operating Income
Toyota’s operating income increased by ¥31.7 billion, or 1.4%, to
¥2,270.3 billion during fiscal 2008 compared with the prior year.
Operating income was favorably affected by the vehicle unit
sales growth, the changes in sales mix, the impact of increased
parts sales, continued cost reduction efforts and the favorable
impact of fluctuations in foreign currency translation rates. These
increases were partially offset by increases in research and devel-
opment expenses and the increases in expenses due to business
expansion. As a result, operating income decreased to 8.6% as a
percentage of net revenues for fiscal 2008 compared to 9.3% in
the prior year.
During fiscal 2008, operating income (before the elimination
of intersegment profits) for significant geographic regions
decreased by ¥16.9 billion, or 1.2%, in Japan, decreased by
¥144.3 billion, or 32.1%, in North America, increased by ¥4.2 bil-
lion, or 3.0% in Europe, increased by ¥138.8 billion, or 118.0%, in
Asia, and increased by ¥60.4 billion, or 72.4% in Other com-
pared with the prior year. The decrease in Japan was mainly due
to an increase in expenses including research and development
expenses, partially offset by the vehicle unit sales growth in the
export markets and continued cost reduction efforts. The
decrease in North America was mainly due to an increase in
valuation losses on interest rate swaps stated at fair value and
the impact of fluctuations in foreign currency translation rates
partially offset by the increase in production volume and vehicle
unit sales and continued cost reduction efforts in the manufac-
turing operations. The increases in Europe were mainly due to
the impact of an increase in production volume and vehicle unit
sales, continued cost reduction efforts in the manufacturing
operations and the favorable impact of fluctuations in foreign
currency translation rates. The increases in Asia were mainly due
to the impact of an increase in production volume and vehicle
unit sales. The increase in Other was primarily due to the impact
of the increase in production volume and vehicle unit sales.
The following is a discussion of operating income for each of
Toyota’s business segments. The operating income amounts
discussed are before the elimination of intersegment profits.
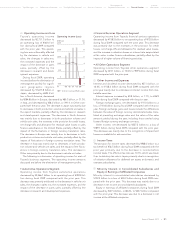
• Automotive Operations Segment
Operating income from Toyota’s automotive operations
increased by ¥133.1 billion, or 6.5%, to ¥2,171.9 billion during
fiscal 2008 compared with the prior year. This increase is primari-
ly attributed to the increase in vehicle unit sales, the increase in
parts sales, the impact of continued cost reduction efforts and
the favorable impact of fluctuations in foreign currency transla-
tion rates. This increase was partially offset by the increase in