Toyota 2009 Annual Report Download - page 54
Download and view the complete annual report
Please find page 54 of the 2009 Toyota annual report below. You can navigate through the pages in the report by either clicking on the pages listed below, or by using the keyword search tool below to find specific information within the annual report.-
 1
1 -
2
-
3
-
4
-
5
-
6
-
7
-
8
-
9
-
10
-
11
-
12
-
13
-
14
-
15
-
16
-
17
-
18
-
19
-
20
-
21
-
22
-
23
-
24
-
25
-
26
-
27
-
28
-
29
-
30
-
31
-
32
-
33
-
34
-
35
-
36
-
37
-
38
-
39
-
40
-
41
-
42
-
43
-
 44
44 -
 45
45 -
 46
46 -
 47
47 -
 48
48 -
 49
49 -
 50
50 -
 51
51 -
 52
52 -
 53
53 -
 54
54 -
 55
55 -
 56
56 -
 57
57 -
 58
58 -
 59
59 -
 60
60 -
 61
61 -
 62
62 -
 63
63 -
 64
64 -
65
-
66
-
67
-
68
-
69
-
70
-
71
-
72
-
73
-
74
-
75
-
76
-
77
-
78
-
79
-
80
-
81
-
82
-
83
-
84
-
85
-
86
-
87
-
88
-
89
-
90
-
91
-
92
-
93
-
94
-
95
-
96
-
97
-
98
-
99
-
100
-
101
-
102
-
103
-
104
-
105
-
106
-
107
-
108
-
109
-
110
-
111
-
112
 |
 |

Financial Section
TOYOTA MOTOR CORPORATION
52
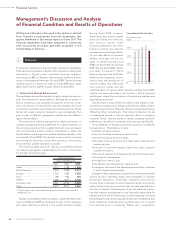
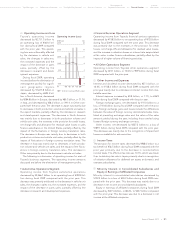
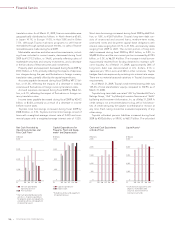
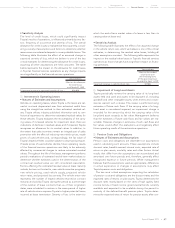
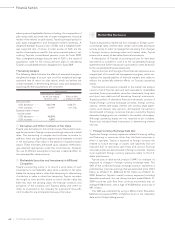
Net Income and Loss
Toyota’s net income decreased
by ¥2,154.8 billion to a loss of
¥437.0 billion during fiscal 2009
compared with the prior year.
Other Comprehensive
Income and Loss
Other comprehensive losses
decreased by ¥76.0 billion to
losses of ¥866.5 billion for fiscal
2009 compared with the prior
year. This decrease in losses
resulted primarily from favorable
foreign currency translation
adjustments in fiscal 2009 to loss-
es of ¥381.3 billion compared
with losses of ¥461.1 billion in the
prior year, and a decrease in
unrealized holding losses on
securities in fiscal 2009 to ¥293.1
billion compared with ¥347.8 bil-
lion in the prior year. The decrease in unrealized holding losses
on securities was mainly due to the recognition of impairment
losses on available-for sale securities.
Results of Operations—
Fiscal 2008 Compared with Fiscal 2007
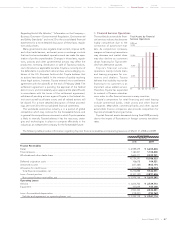
Net Revenues
Toyota had net revenues for fiscal 2008 of ¥26,289.2 billion, an
increase of ¥2,341.2 billion, or 9.8%, compared with the prior
year. This increase principally reflects the impact of increased
vehicle unit sales, increased financings operations, increased
parts sales and the favorable impact of fluctuations in foreign
currency translation rates during fiscal 2008. Eliminating the differ-
ence in the Japanese yen value used for translation purposes, net
revenues would have been approximately ¥26,011.5 billion during
fiscal 2008, an 8.6% increase compared with the prior year.
Toyota’s net revenues include net revenues from sales of prod-
ucts that increased by 9.5% during fiscal 2008 compared with
the prior year to ¥24,820.5 billion and net revenues from financ-
ing operations that increased by 14.9% during fiscal 2008 com-
pared with the prior year to ¥1,468.7 billion. Eliminating the
difference in the Japanese yen value used for translation pur-
poses, net revenues from sales of products would have been
approximately ¥24,540.1 billion, an 8.2% increase during fiscal
2008 compared with the prior year, while net revenues from
financing operations would have increased by approximately
15.1% during fiscal 2008 compared to the prior year to ¥1,471.4
billion. Geographically, net revenues for fiscal 2008 increased by
3.3% in Japan, 5.4% in North America, 13.7% in Europe, 41.7%
in Asia and 18.7% in Other compared with the prior year.
Eliminating the difference in the Japanese yen value used for
translation purposes, net revenues in fiscal 2008 would have
increased by 3.3% in Japan, 7.6% in North America, 6.8% in
Europe, 34.2% in Asia, and 13.6% in Other compared with the
prior year.
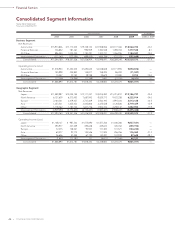
The following is a discussion of net revenues for each of
Toyota’s business segments. The net revenue amounts discussed
are amounts before the elimination of intersegment revenues.
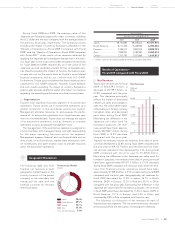
• Automotive Operations Segment
Net revenues from Toyota’s automotive operations segment,
which constitute the largest percentage of Toyota’s net reve-
nues, increased during fiscal 2008 by ¥2,249.3 billion, or 10.3%
compared with the prior year to ¥24,177.3 billion. The increase
resulted primarily from the approximate ¥1,600 billion impact
attributed to the vehicle unit sales growth and changes in sales
mix, the ¥277.5 billion impact of fluctuations in foreign currency
translation rates during fiscal 2008, and the impact of increased
parts sales. Eliminating the difference in the Japanese yen value
used for translation purposes, automotive operations segment
net revenues would have been approximately ¥23,899.8 billion
during fiscal 2008, a 9.0% increase compared to the prior year. In
fiscal 2008, net revenues in Japan were favorably impacted pri-
marily by vehicle unit sales growth in the export markets, which
was partially offset by changes in sales mix compared to fiscal
2007. Net revenues in North America were favorably impacted
primarily by vehicle unit sales growth partially offset by fluctua-
tions in foreign currency translation rates during fiscal 2008. Net
revenues in Europe and Asia were favorably impacted primarily
by vehicle unit sales growth and fluctuations in foreign currency
translation rates during fiscal 2008. Net revenues in Other were
favorably impacted primarily by vehicle unit sales growth.
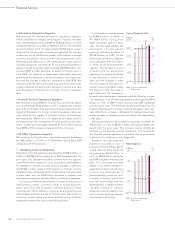
• Financial Services Operations Segment
Net revenues in fiscal 2008 for Toyota’s financial services opera-
tions increased by ¥197.8 billion or 15.2% compared to the prior
year to ¥1,498.3 billion. This increase resulted primarily from the
impact of a higher volume of financings mainly in North
America, partially offset by the impact of fluctuations in foreign
currency translation rates during fiscal 2008. Eliminating the dif-
ference in the Japanese yen value used for translation purposes,
financial services operations net revenues would have been
approximately ¥1,500.5 billion during fiscal 2008, a 15.4%
increase compared with the prior year.
• All Other Operations Segment
Net revenues for Toyota’s other businesses increased by ¥23.2
billion, or 1.8%, to ¥1,346.9 billion during fiscal 2008 compared
with the prior year.
Operating Costs and Expenses
Operating costs and expenses increased by ¥2,309.5 billion, or
10.6%, to ¥24,018.9 billion during fiscal 2008 compared with the
Net Income (Loss),
and ROE
-500
0
500
1,000
1,500
2,000
(¥ Billion)
’08’07 ’09’06’05FY
-5
0
5
10
15
20
(%)
ROE (Ri
g
ht scale)