Toyota 2009 Annual Report Download - page 46
Download and view the complete annual report
Please find page 46 of the 2009 Toyota annual report below. You can navigate through the pages in the report by either clicking on the pages listed below, or by using the keyword search tool below to find specific information within the annual report.-
 1
1 -
2
-
3
-
4
-
5
-
6
-
7
-
8
-
9
-
10
-
11
-
12
-
13
-
14
-
15
-
16
-
17
-
18
-
19
-
20
-
21
-
22
-
23
-
24
-
25
-
26
-
27
-
28
-
29
-
30
-
31
-
32
-
33
-
34
-
35
-
 36
36 -
 37
37 -
 38
38 -
 39
39 -
 40
40 -
 41
41 -
 42
42 -
 43
43 -
 44
44 -
 45
45 -
 46
46 -
 47
47 -
 48
48 -
 49
49 -
 50
50 -
 51
51 -
 52
52 -
 53
53 -
 54
54 -
 55
55 -
 56
56 -
57
-
58
-
59
-
60
-
61
-
62
-
63
-
64
-
65
-
66
-
67
-
68
-
69
-
70
-
71
-
72
-
73
-
74
-
75
-
76
-
77
-
78
-
79
-
80
-
81
-
82
-
83
-
84
-
85
-
86
-
87
-
88
-
89
-
90
-
91
-
92
-
93
-
94
-
95
-
96
-
97
-
98
-
99
-
100
-
101
-
102
-
103
-
104
-
105
-
106
-
107
-
108
-
109
-
110
-
111
-
112
 |
 |

Financial Section
TOYOTA MOTOR CORPORATION
44
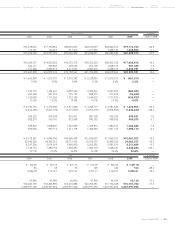
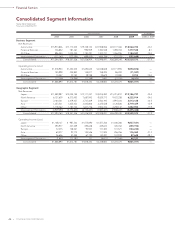
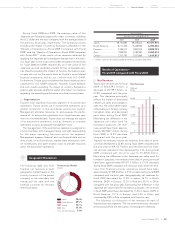
Consolidated Segment Information
Yen in millions % change
2004 2005 2006 2007 2008 2009 2008 vs 2009
Business Segment:
Net Revenues:
Automotive ............................. ¥15,973,826 ¥17,113,535 ¥19,338,144 ¥21,928,006 ¥24,177,306 ¥18,564,723 -23.2
Financial Services ................... 736,852 781,261 996,909 1,300,548 1,498,354 1,377,548 -8.1
All Other ................................. 896,244 1,030,320 1,190,291 1,323,731 1,346,955 1,184,947 -12.0
Intersegment Elimination ...... (312,162) (373,590) (488,435) (604,194) (733,375) (597,648) —
Consolidated ...................... ¥17,294,760 ¥18,551,526 ¥21,036,909 ¥23,948,091 ¥26,289,240 ¥20,529,570 -21.9
Operating Income (Loss):
Automotive ............................. ¥1,518,954 ¥1,452,535 ¥1,694,045 ¥2,038,828 ¥2,171,905 ¥(394,876) —
Financial Services ................... 145,998 200,853 155,817 158,495 86,494 (71,947) —
All Other ................................. 15,247 33,743 39,748 39,679 33,080 9,913 -70.0
Intersegment Elimination ...... (13,309) (14,944) (11,268) 1,681 (21,104) (4,101) —
Consolidated ...................... ¥1,666,890 ¥1,672,187 ¥1,878,342 ¥2,238,683 ¥2,270,375 ¥(461,011) —
Geographic Segment:
Net Revenues:
Japan....................................... ¥11,589,987 ¥12,004,155 ¥13,111,457 ¥14,815,282 ¥15,315,812 ¥12,186,737 -20.4
North America ........................ 6,127,639 6,373,453 7,687,942 9,029,773 9,423,258 6,222,914 -34.0
Europe .................................... 2,164,341 2,479,427 2,727,409 3,542,193 3,993,434 3,013,128 -24.5
Asia .......................................... 1,243,521 1,625,422 2,042,806 2,225,528 3,120,826 2,719,329 -12.9
Other ....................................... 1,118,362 1,183,702 1,601,736 1,922,742 2,294,137 1,882,900 -17.9
Intersegment Elimination ...... (4,949,090) (5,114,633) (6,134,441) (7,587,427) (7,858,227) (5,495,438) —
Consolidated ...................... ¥17,294,760 ¥18,551,526 ¥21,036,909 ¥23,948,091 ¥26,289,240 ¥20,529,570 -21.9
Operating Income (Loss):
Japan....................................... ¥1,108,127 ¥ 987,242 ¥1,075,890 ¥1,457,246 ¥1,440,286 ¥(237,531) —
North America ........................ 390,977 447,559 495,638 449,633 305,352 (390,192) —
Europe .................................... 72,475 108,541 93,947 137,383 141,571 (143,233) —
Asia .......................................... 60,277 93,772 145,546 117,595 256,356 176,060 -31.3
Other ....................................... 36,636 47,454 67,190 83,497 143,978 87,648 -39.1
Intersegment Elimination ...... (1,602) (12,381) 131 (6,671) (17,168) 46,237 —
Consolidated ...................... ¥1,666,890 ¥1,672,187 ¥1,878,342 ¥2,238,683 ¥2,270,375 ¥(461,011) —
Toyota Motor Corporation
Fiscal years ended March 31