Toyota 2009 Annual Report Download - page 58
Download and view the complete annual report
Please find page 58 of the 2009 Toyota annual report below. You can navigate through the pages in the report by either clicking on the pages listed below, or by using the keyword search tool below to find specific information within the annual report.-
 1
1 -
2
-
3
-
4
-
5
-
6
-
7
-
8
-
9
-
10
-
11
-
12
-
13
-
14
-
15
-
16
-
17
-
18
-
19
-
20
-
21
-
22
-
23
-
24
-
25
-
26
-
27
-
28
-
29
-
30
-
31
-
32
-
33
-
34
-
35
-
36
-
37
-
38
-
39
-
40
-
41
-
42
-
43
-
44
-
45
-
46
-
47
-
 48
48 -
 49
49 -
 50
50 -
 51
51 -
 52
52 -
 53
53 -
 54
54 -
 55
55 -
 56
56 -
 57
57 -
 58
58 -
 59
59 -
 60
60 -
 61
61 -
 62
62 -
 63
63 -
 64
64 -
 65
65 -
 66
66 -
 67
67 -
 68
68 -
69
-
70
-
71
-
72
-
73
-
74
-
75
-
76
-
77
-
78
-
79
-
80
-
81
-
82
-
83
-
84
-
85
-
86
-
87
-
88
-
89
-
90
-
91
-
92
-
93
-
94
-
95
-
96
-
97
-
98
-
99
-
100
-
101
-
102
-
103
-
104
-
105
-
106
-
107
-
108
-
109
-
110
-
111
-
112
 |
 |

Financial Section
TOYOTA MOTOR CORPORATION
56
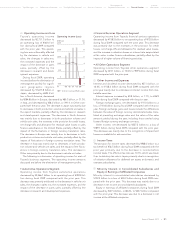
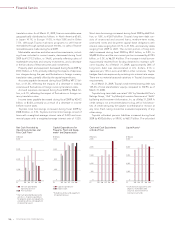
Cash and Cash Equivalents
at End of Year
0
500
1,000
1,500
2,000
2,500
(¥ Billion)
’08’07 ’09’06’05FY
Capital Expenditures for
Property, Plant and Equip-
ment* and Depreciation
0
400
800
1,200
1,600
(¥ Billion)
’08’07 ’09’06’05FY
Capital expenditures
Depreciation
* Excluding vehicles and equipment
on operating leases
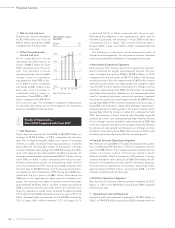
Liquid Assets*
0
1,000
2,000
3,000
4,000
5,000
(¥ Billion)
’08’07 ’09’06’05FY
* Cash and cash equivalents, time
deposits, marketable debt
securities and investment in
monetary trust funds
Net Cash Provided by
Operating Activities and
Free Cash Flow*
0
1,000
2,000
3,000
4,000
(¥ Billion)
’08’07 ’09’06’05FY
Net cash provided by
operating activities
Free cash flow
* (Net cash provided by operating
activities) – (Capital expenditures
for property, plant and equipment,
excluding vehicles and equipment
on operatin
g
leases)
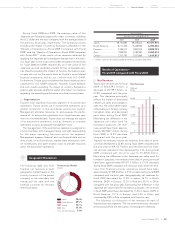
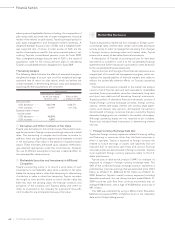
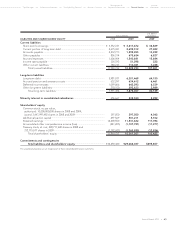
translation rates. As of March 31, 2009, finance receivables were
geographically distributed as follows: in North America 63.6%,
in Japan 14.1%, in Europe 11.0%, in Asia 3.8% and in Other
7.5%. Although Toyota maintains programs to sell finance
receivables through special purpose entities, no sales of finance
receivables were made during fiscal 2009.
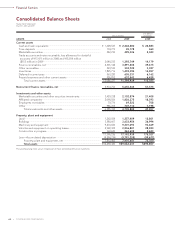
Marketable securities and other securities investments, includ-
ing those included in current assets, decreased during fiscal
2009 by ¥1,373.2 billion, or 34.6%, primarily reflecting sales of
marketable securities and security investments, and a decrease
in the fair values of these securities and investments.
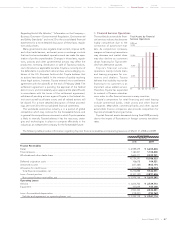
Property, plant and equipment decreased during fiscal 2009 by
¥410.3 billion, or 5.3%, primarily reflecting the impacts of deprecia-
tion charges during the year and fluctuations in foreign currency
translation rates, partially offset by the capital expenditures.
Accounts payable decreased during fiscal 2009 by ¥913.3 bil-
lion, or 41.3%, reflecting the impacts of a decrease in trading
volumes and fluctuations in foreign currency translation rates.
Accrued expenses decreased during fiscal 2009 by ¥66.2 bil-
lion, or 4.1%, reflecting the impact of fluctuations in foreign cur-
rency translation rates.
Income taxes payable decreased during fiscal 2009 by ¥254.2
billion, or 83.2%, primarily as a result of a decrease in income
before income taxes.
Toyota’s total borrowings increased during fiscal 2009 by
¥408.5 billion, or 3.3%. Toyota’s short-term borrowings consist of
loans with a weighted-average interest rate of 2.44% and com-
mercial paper with a weighted-average interest rate of 1.52%.
Short-term borrowings increased during fiscal 2009 by ¥64.9 bil-
lion, or 1.8%, to ¥3,617.6 billion. Toyota’s long-term debt con-
sists of unsecured and secured loans, medium-term notes,
unsecured notes and long-term capital lease obligations with
interest rates ranging from 0.17% to 31.50%, and maturity dates
ranging from 2009 to 2047. The current portion of long-term
debt increased during fiscal 2009 by ¥24.1 billion, or 0.9%, to
¥2,699.5 billion and the non-current portion increased by ¥319.5
billion, or 5.3%, to ¥6,301.4 billion. The increase in total borrow-
ings primarily resulted from funding obtained to maintain suffi-
cient liquidity. As of March 31, 2009, approximately 28% of
long-term debt was denominated in U.S. dollars, 21% in
Japanese yen, 15% in euros and 36% in other currencies. Toyota
hedges fixed rate exposure by entering into interest rate swaps.
There are no material seasonal variations in Toyota’s borrowings
requirements.
As of March 31, 2009, Toyota’s total interest bearing debt was
125.4% of total shareholders’ equity, compared to 102.9% as of
March 31, 2008.
Toyota’s long-term debt was rated “AA” by Standard & Poor’s
Ratings Group, “Aa1” by Moody’s Investors Services and “AAA”
by Rating and Investment Information, Inc. as of May 31, 2009. A
credit rating is not a recommendation to buy, sell or hold securi-
ties. A credit rating may be subject to withdrawal or revision at
any time. Each rating should be evaluated separately of any
other rating.
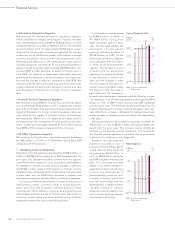
Toyota’s unfunded pension liabilities increased during fiscal
2009 by ¥242.6 billion, or 59.0%, to ¥653.7 billion. The unfunded