Toyota 2009 Annual Report Download - page 47
Download and view the complete annual report
Please find page 47 of the 2009 Toyota annual report below. You can navigate through the pages in the report by either clicking on the pages listed below, or by using the keyword search tool below to find specific information within the annual report.-
 1
1 -
2
-
3
-
4
-
5
-
6
-
7
-
8
-
9
-
10
-
11
-
12
-
13
-
14
-
15
-
16
-
17
-
18
-
19
-
20
-
21
-
22
-
23
-
24
-
25
-
26
-
27
-
28
-
29
-
30
-
31
-
32
-
33
-
34
-
35
-
36
-
 37
37 -
 38
38 -
 39
39 -
 40
40 -
 41
41 -
 42
42 -
 43
43 -
 44
44 -
 45
45 -
 46
46 -
 47
47 -
 48
48 -
 49
49 -
 50
50 -
 51
51 -
 52
52 -
 53
53 -
 54
54 -
 55
55 -
 56
56 -
 57
57 -
58
-
59
-
60
-
61
-
62
-
63
-
64
-
65
-
66
-
67
-
68
-
69
-
70
-
71
-
72
-
73
-
74
-
75
-
76
-
77
-
78
-
79
-
80
-
81
-
82
-
83
-
84
-
85
-
86
-
87
-
88
-
89
-
90
-
91
-
92
-
93
-
94
-
95
-
96
-
97
-
98
-
99
-
100
-
101
-
102
-
103
-
104
-
105
-
106
-
107
-
108
-
109
-
110
-
111
-
112
 |
 |

The Right Way Forward Business OverviewPerformance Overview Financial Section
Investor
Information
Management &
Corporate Information
Top Messages
Annual Report 2009 45
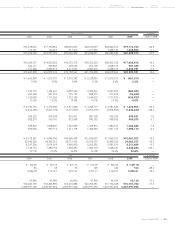
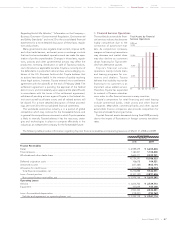
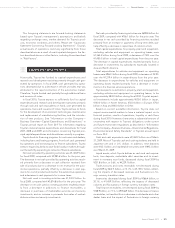
Consolidated Quarterly Financial Summary
Yen in billions
2008 2009
First Quarter Second Quarter Third Quarter Fourth Quarter First Quarter Second Quarter Third Quarter Fourth Quarter
Net Revenues ................................................ ¥6,522.6 ¥6,489.6 ¥6,709.9 ¥6,567.1 ¥6,215.1 ¥5,975.3 ¥4,802.8 ¥3,536.3
% Change .................................................. 15.7% 11.2% 9.2% 3.8% -4.7% -7.9% -28.4% -46.2%
Operating Income (Loss) .............................. 675.4 596.7 601.5 396.7 412.5 169.5 (360.6) (682.5)
% Change .................................................. 31.8% 2.7% 4.7% -30.5% -38.9% -71.6% —% —%
Operating Income Margin ........................... 10.4% 9.2% 9.0% 6.0% 6.6% 2.8% -7.5% -19.3%
Income (Loss) before Income Taxes,
Minority Interest and Equity in
Earnings of Affiliated Companies .............. 739.0 623.2 652.7 422.3 453.0 183.4 (282.1) (914.7)
% Change .................................................. 33.2% 1.9% 6.0% -29.7% -38.7% -70.6% —% —%
Net Income (Loss) ......................................... 491.5 450.9 458.6 316.8 353.6 139.8 (164.7) (765.8)
% Change .................................................. 32.3% 11.1% 7.5% -28.0% -28.1% -69.0% —% —%
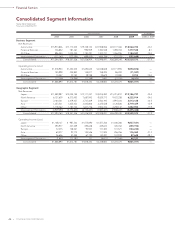
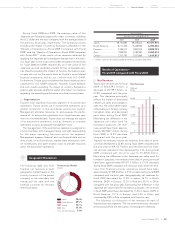
Business Segment:
Net Revenues:
Automotive ............................................ ¥6,014.3 ¥5,925.3 ¥6,180.4 ¥6,057.3 ¥5,720.9 ¥5,439.8 ¥4,311.1 ¥3,092.9
Financial Services .................................. 378.6 406.7 391.7 321.3 363.1 374.6 346.6 293.2
All Other ................................................ 293.0 321.0 333.6 399.3 288.2 314.2 294.3 288.2
Intersegment Elimination ..................... (163.3) (163.4) (195.8) (210.8) (157.1) (153.3) (149.2) (138.0)
Consolidated ..................................... ¥6,522.6 ¥6,489.6 ¥6,709.9 ¥6,567.1 ¥6,215.1 ¥5,975.3 ¥4,802.8 ¥3,536.3
Operating Income (Loss):
Automotive ............................................ ¥622.1 ¥559.5 ¥567.8 ¥422.5 ¥332.3 ¥133.6 ¥(232.7) ¥(628.1)
Financial Services .................................. 48.3 29.5 20.9 (12.2) 79.1 28.1 (123.9) (55.4)
All Other ................................................ 4.1 6.0 11.8 11.1 2.9 8.9 0 (1.9)
Intersegment Elimination ..................... 0.9 1.7 1.0 (24.7) (1.8) (1.1) (4.0) 2.9
Consolidated ..................................... ¥675.4 ¥596.7 ¥601.5 ¥396.7 ¥412.5 ¥169.5 ¥(360.6) ¥(682.5)
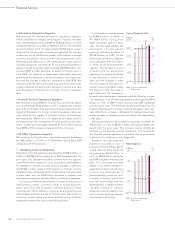
Geographic Segment:
Net Revenues:
Japan...................................................... ¥ 3,662.9 ¥ 3,653.9 ¥ 3,984.8 ¥ 4,014.2 ¥ 3,660.8 ¥ 3,546.5 ¥ 3,014.1 ¥1,965.3
North America ....................................... 2,510.9 2,399.0 2,369.8 2,143.5 2,091.1 1,861.9 1,339.0 930.9
Europe ................................................... 1,019.0 1,001.6 983.1 989.7 916.2 867.7 660.5 568.7
Asia ......................................................... 720.1 785.2 811.2 804.4 798.3 827.7 683.9 409.5
Other ...................................................... 559.7 569.2 641.2 524.0 628.7 592.7 381.5 280.0
Intersegment Elimination ..................... (1,950.0) (1,919.3) (2,080.2) (1,908.7) (1,880.0) (1,721.2) (1,276.2) (618.1)
Consolidated ..................................... ¥ 6,522.6 ¥ 6,489.6 ¥ 6,709.9 ¥ 6,567.1 ¥ 6,215.1 ¥ 5,975.3 ¥ 4,802.8 ¥3,536.3
Operating Income (Loss):
Japan...................................................... ¥396.6 ¥376.7 ¥389.4 ¥277.6 ¥217.1 ¥104.6 ¥(164.2) ¥(395.0)
North America ....................................... 160.2 93.9 63.6 (12.4) 69.1 (34.9) (247.4) (177.0)
Europe ................................................... 38.5 29.8 34.0 39.2 20.3 (11.5) (43.4) (108.7)
Asia ......................................................... 49.6 67.1 64.3 75.4 69.3 67.8 40.5 (1.6)
Other ...................................................... 38.6 33.1 49.9 22.3 44.5 34.6 33.5 (25.1)
Intersegment Elimination ..................... (8.1) (3.9) 0.3 (5.4) (7.8) 8.9 20.4 24.9
Consolidated ..................................... ¥675.4 ¥596.7 ¥601.5 ¥396.7 ¥412.5 ¥169.5 ¥(360.6) ¥(682.5)
Toyota Motor Corporation
Fiscal years ended March 31