Coca Cola 2013 Annual Report Download - page 101
Download and view the complete annual report
Please find page 101 of the 2013 Coca Cola annual report below. You can navigate through the pages in the report by either clicking on the pages listed below, or by using the keyword search tool below to find specific information within the annual report.-
 1
1 -
2
-
3
-
4
-
5
-
6
-
7
-
8
-
9
-
10
-
11
-
12
-
13
-
14
-
15
-
16
-
17
-
18
-
19
-
20
-
21
-
22
-
23
-
24
-
25
-
26
-
27
-
28
-
29
-
30
-
31
-
32
-
33
-
34
-
35
-
36
-
37
-
38
-
39
-
40
-
41
-
42
-
43
-
44
-
45
-
46
-
47
-
48
-
49
-
50
-
51
-
52
-
53
-
54
-
55
-
56
-
57
-
58
-
59
-
60
-
61
-
62
-
63
-
64
-
65
-
66
-
67
-
68
-
69
-
70
-
71
-
72
-
73
-
74
-
75
-
76
-
77
-
78
-
79
-
80
-
81
-
82
-
83
-
84
-
85
-
86
-
87
-
88
-
89
-
90
-
 91
91 -
 92
92 -
 93
93 -
 94
94 -
 95
95 -
 96
96 -
 97
97 -
 98
98 -
 99
99 -
 100
100 -
 101
101 -
 102
102 -
 103
103 -
 104
104 -
 105
105 -
 106
106 -
 107
107 -
 108
108 -
 109
109 -
 110
110 -
 111
111 -
112
-
113
-
114
-
115
-
116
-
117
-
118
-
119
-
120
-
121
-
122
-
123
-
124
-
125
-
126
-
127
-
128
-
129
-
130
-
131
-
132
-
133
-
134
-
135
-
136
-
137
-
138
-
139
-
140
-
141
-
142
-
143
-
144
-
145
-
146
-
147
-
148
-
149
-
150
-
151
-
152
-
153
-
154
-
155
-
156
-
157
-
158
-
159
-
160
 |
 |

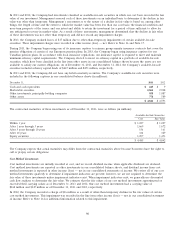
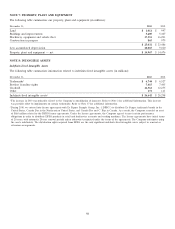
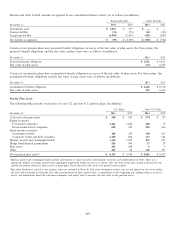
The following table provides information related to the carrying value of our goodwill by operating segment (in millions):
Eurasia & Latin North Bottling
Africa Europe America America Pacific Investments Total
2012
Balance as of January 1 $ 35 $ 710 $ 163 $ 10,515 $ 117 $ 679 $ 12,219
Effect of foreign currency translation (1) (19) 5 — 6 (4) (13)
Acquisitions1— — — 100 — 157 257
Adjustments related to the finalization
of purchase accounting1— — — (38) — — (38)
Divestitures, deconsolidations and other2— — — — — (170) (170)
Balance as of December 31 $ 34 $ 691 $ 168 $ 10,577 $ 123 $ 662 $ 12,255
2013
Balance as of January 1 $ 34 $ 691 $ 168 $ 10,577 $ 123 $ 662 $ 12,255
Effect of foreign currency translation (3) 29 (12) — (6) 10 18
Acquisitions15 102 — — — 20 127
Adjustments related to the finalization
of purchase accounting1— — — (4) — (1) (5)
Impairment3— — — — — (82) (82)
Divestitures, deconsolidations and other — — — (1) — — (1)
Balance as of December 31 $ 36 $ 822 $ 156 $ 10,572 $ 117 $ 609 $ 12,312
1Refer to Note 2 for information related to the Company’s acquisitions and divestitures.
2Relates to the transfer of goodwill associated with the Company’s consolidated Philippine and Brazilian bottling operations to assets held for sale as
of December 31, 2012. Refer to Note 2 for additional information related to these transactions.
3Refer to Note 17 for information related to the Company’s impairment of goodwill.
Definite-Lived Intangible Assets
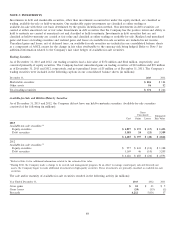
The following table summarizes information related to definite-lived intangible assets (in millions):
December 31, 2013 December 31, 2012
Gross Gross
Carrying Accumulated Carrying Accumulated
Amount Amortization Net Amount Amortization Net
Customer relationships $ 642 $ (202) $ 440 $ 622 $ (166) $ 456
Bottlers’ franchise rights 722 (317) 405 730 (221) 509
Trademarks 105 (26) 79 65 (43) 22
Other 128 (83) 45 129 (77) 52
Total $ 1,597 $ (628) $ 969 $ 1,546 $ (507) $ 1,039
Total amortization expense for intangible assets subject to amortization was $165 million, $173 million and $192 million in 2013,
2012 and 2011, respectively. Based on the carrying value of definite-lived intangible assets as of December 31, 2013, we estimate
our amortization expense for the next five years will be as follows (in millions):
Amortization
Expense
2014 $ 160
2015 152
2016 145
2017 112
2018 54
99