Coca Cola 2013 Annual Report Download - page 51
Download and view the complete annual report
Please find page 51 of the 2013 Coca Cola annual report below. You can navigate through the pages in the report by either clicking on the pages listed below, or by using the keyword search tool below to find specific information within the annual report.-
 1
1 -
2
-
3
-
4
-
5
-
6
-
7
-
8
-
9
-
10
-
11
-
12
-
13
-
14
-
15
-
16
-
17
-
18
-
19
-
20
-
21
-
22
-
23
-
24
-
25
-
26
-
27
-
28
-
29
-
30
-
31
-
32
-
33
-
34
-
35
-
36
-
37
-
38
-
39
-
40
-
 41
41 -
 42
42 -
 43
43 -
 44
44 -
 45
45 -
 46
46 -
 47
47 -
 48
48 -
 49
49 -
 50
50 -
 51
51 -
 52
52 -
 53
53 -
 54
54 -
 55
55 -
 56
56 -
 57
57 -
 58
58 -
 59
59 -
 60
60 -
 61
61 -
62
-
63
-
64
-
65
-
66
-
67
-
68
-
69
-
70
-
71
-
72
-
73
-
74
-
75
-
76
-
77
-
78
-
79
-
80
-
81
-
82
-
83
-
84
-
85
-
86
-
87
-
88
-
89
-
90
-
91
-
92
-
93
-
94
-
95
-
96
-
97
-
98
-
99
-
100
-
101
-
102
-
103
-
104
-
105
-
106
-
107
-
108
-
109
-
110
-
111
-
112
-
113
-
114
-
115
-
116
-
117
-
118
-
119
-
120
-
121
-
122
-
123
-
124
-
125
-
126
-
127
-
128
-
129
-
130
-
131
-
132
-
133
-
134
-
135
-
136
-
137
-
138
-
139
-
140
-
141
-
142
-
143
-
144
-
145
-
146
-
147
-
148
-
149
-
150
-
151
-
152
-
153
-
154
-
155
-
156
-
157
-
158
-
159
-
160
 |
 |

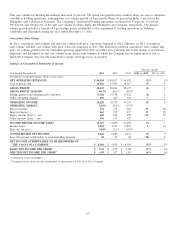
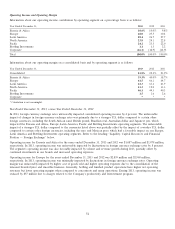
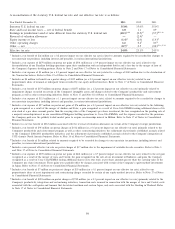
Year Ended December 31, 2012, versus Year Ended December 31, 2011
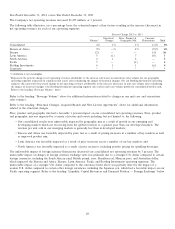
The Company’s net operating revenues increased $1,475 million, or 3 percent.
The following table illustrates, on a percentage basis, the estimated impact of key factors resulting in the increase (decrease) in
net operating revenues for each of our operating segments:
Percent Change 2012 vs. 2011
Structural Price, Product & Currency
Volume1Changes Geographic Mix Fluctuations Total
Consolidated 4% 1% 1% (3)% 3%
Eurasia & Africa 9% —% 4% (9)% 4%
Europe (2) — — (4) (6)
Latin America 5 (1) 7 (8) 3
North America 2 1 2 — 5
Pacific 5 — (1) — 4
Bottling Investments 6 3 1 (6) 4
Corporate * * * * *
* Calculation is not meaningful.
1Represents the percent change in net operating revenues attributable to the increase (decrease) in concentrate sales volume for our geographic
operating segments (expressed in equivalent unit cases) after considering the impact of structural changes. For our Bottling Investments operating
segment, this represents the percent change in net operating revenues attributable to the increase (decrease) in unit case volume after considering
the impact of structural changes. Our Bottling Investments operating segment data reflects unit case volume growth for consolidated bottlers only.
Refer to the heading ‘‘Beverage Volume’’ above.
Refer to the heading ‘‘Beverage Volume’’ above for additional information related to changes in our unit case and concentrate
sales volumes.
Refer to the heading ‘‘Structural Changes, Acquired Brands and New License Agreements’’ above for additional information
related to the structural changes.
Price, product and geographic mix had a favorable 1 percent impact on our consolidated net operating revenues. Price, product
and geographic mix was impacted by a variety of factors and events including, but not limited to, the following:
• Our consolidated results were unfavorably impacted by geographic mix as a result of growth in our emerging and
developing markets which are recovering from the global recession at a quicker pace than our developed markets. The
revenue per unit sold in our emerging markets is generally less than in developed markets;
• Eurasia and Africa was favorably impacted by price mix as a result of pricing increases in a number of key markets as well
as improved product mix;
• Latin America was favorably impacted as a result of price increases across a number of our key markets; and
• North America was favorably impacted as a result of price increases, including positive pricing for sparkling beverages.
The unfavorable impact of foreign currency fluctuations decreased our consolidated net operating revenues by 3 percent. The
unfavorable impact of changes in foreign currency exchange rates was primarily due to a stronger U.S. dollar compared to certain
foreign currencies, including the South African rand, British pound, euro, Brazilian real, Mexican peso, and Australian dollar,
which impacted the Eurasia and Africa, Europe, Latin America, Pacific and Bottling Investments operating segments. The
unfavorable impact of a stronger U.S. dollar compared to the currencies listed above was partially offset by the impact of a
weaker U.S. dollar compared to certain other foreign currencies, including the Japanese yen, which had a favorable impact on our
Pacific operating segment. Refer to the heading ‘‘Liquidity, Capital Resources and Financial Position — Foreign Exchange’’ below.
49