Coca Cola 2013 Annual Report Download - page 31
Download and view the complete annual report
Please find page 31 of the 2013 Coca Cola annual report below. You can navigate through the pages in the report by either clicking on the pages listed below, or by using the keyword search tool below to find specific information within the annual report.-
 1
1 -
2
-
3
-
4
-
5
-
6
-
7
-
8
-
9
-
10
-
11
-
12
-
13
-
14
-
15
-
16
-
17
-
18
-
19
-
20
-
 21
21 -
 22
22 -
 23
23 -
 24
24 -
 25
25 -
 26
26 -
 27
27 -
 28
28 -
 29
29 -
 30
30 -
 31
31 -
 32
32 -
 33
33 -
 34
34 -
 35
35 -
 36
36 -
 37
37 -
 38
38 -
 39
39 -
 40
40 -
 41
41 -
42
-
43
-
44
-
45
-
46
-
47
-
48
-
49
-
50
-
51
-
52
-
53
-
54
-
55
-
56
-
57
-
58
-
59
-
60
-
61
-
62
-
63
-
64
-
65
-
66
-
67
-
68
-
69
-
70
-
71
-
72
-
73
-
74
-
75
-
76
-
77
-
78
-
79
-
80
-
81
-
82
-
83
-
84
-
85
-
86
-
87
-
88
-
89
-
90
-
91
-
92
-
93
-
94
-
95
-
96
-
97
-
98
-
99
-
100
-
101
-
102
-
103
-
104
-
105
-
106
-
107
-
108
-
109
-
110
-
111
-
112
-
113
-
114
-
115
-
116
-
117
-
118
-
119
-
120
-
121
-
122
-
123
-
124
-
125
-
126
-
127
-
128
-
129
-
130
-
131
-
132
-
133
-
134
-
135
-
136
-
137
-
138
-
139
-
140
-
141
-
142
-
143
-
144
-
145
-
146
-
147
-
148
-
149
-
150
-
151
-
152
-
153
-
154
-
155
-
156
-
157
-
158
-
159
-
160
 |
 |

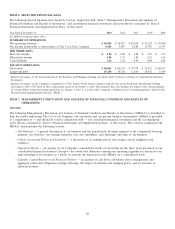
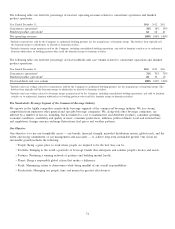
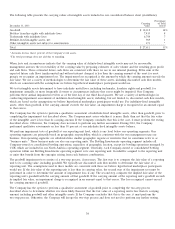
ITEM 6. SELECTED FINANCIAL DATA
The following selected financial data should be read in conjunction with ‘‘Item 7. Management’s Discussion and Analysis of
Financial Condition and Results of Operations’’ and consolidated financial statements and notes thereto contained in ‘‘Item 8.
Financial Statements and Supplementary Data’’ of this report.
Year Ended December 31, 201312012 2011 201022009
(In millions except per share data)
SUMMARY OF OPERATIONS
Net operating revenues $ 46,854 $ 48,017 $ 46,542 $ 35,119 $ 30,990
Net income attributable to shareowners of The Coca-Cola Company 8,584 9,019 8,584 11,787 6,797
PER SHARE DATA
Basic net income $ 1.94 $ 2.00 $ 1.88 $ 2.55 $ 1.47
Diluted net income 1.90 1.97 1.85 2.53 1.46
Cash dividends 1.12 1.02 0.94 0.88 0.82
BALANCE SHEET DATA
Total assets $ 90,055 $ 86,174 $ 79,974 $ 72,921 $ 48,671
Long-term debt 19,154 14,736 13,656 14,041 5,059
1Includes the impact of the deconsolidation of the Brazilian and Philippine bottling operations. Refer to Note 2 of Notes to Consolidated Financial
Statements.
2Includes the impact of the Company’s acquisition of CCE’s former North America business and the sale of our Norwegian and Swedish bottling
operations to New CCE. Both of these transactions occurred on October 2, 2010. This financial data also includes the impact of the deconsolidation
of certain entities, primarily bottling operations, on January 1, 2010, as a result of the Company’s adoption of new accounting guidance issued by the
Financial Accounting Standards Board (‘‘FASB’’).
ITEM 7. MANAGEMENT’S DISCUSSION AND ANALYSIS OF FINANCIAL CONDITION AND RESULTS OF
OPERATIONS
Overview
The following Management’s Discussion and Analysis of Financial Condition and Results of Operations (‘‘MD&A’’) is intended to
help the reader understand The Coca-Cola Company, our operations and our present business environment. MD&A is provided
as a supplement to — and should be read in conjunction with — our consolidated financial statements and the accompanying
notes thereto contained in ‘‘Item 8. Financial Statements and Supplementary Data’’ of this report. This overview summarizes the
MD&A, which includes the following sections:
•Our Business — a general description of our business and the nonalcoholic beverage segment of the commercial beverage
industry, our objective, our strategic priorities, our core capabilities, and challenges and risks of our business.
•Critical Accounting Policies and Estimates — a discussion of accounting policies that require critical judgments and
estimates.
•Operations Review — an analysis of our Company’s consolidated results of operations for the three years presented in our
consolidated financial statements. Except to the extent that differences among our operating segments are material to an
understanding of our business as a whole, we present the discussion in the MD&A on a consolidated basis.
•Liquidity, Capital Resources and Financial Position — an analysis of cash flows; off-balance sheet arrangements and
aggregate contractual obligations; foreign exchange; the impact of inflation and changing prices; and an overview of
financial position.
29