Coca Cola 2013 Annual Report Download - page 113
Download and view the complete annual report
Please find page 113 of the 2013 Coca Cola annual report below. You can navigate through the pages in the report by either clicking on the pages listed below, or by using the keyword search tool below to find specific information within the annual report.-
 1
1 -
2
-
3
-
4
-
5
-
6
-
7
-
8
-
9
-
10
-
11
-
12
-
13
-
14
-
15
-
16
-
17
-
18
-
19
-
20
-
21
-
22
-
23
-
24
-
25
-
26
-
27
-
28
-
29
-
30
-
31
-
32
-
33
-
34
-
35
-
36
-
37
-
38
-
39
-
40
-
41
-
42
-
43
-
44
-
45
-
46
-
47
-
48
-
49
-
50
-
51
-
52
-
53
-
54
-
55
-
56
-
57
-
58
-
59
-
60
-
61
-
62
-
63
-
64
-
65
-
66
-
67
-
68
-
69
-
70
-
71
-
72
-
73
-
74
-
75
-
76
-
77
-
78
-
79
-
80
-
81
-
82
-
83
-
84
-
85
-
86
-
87
-
88
-
89
-
90
-
91
-
92
-
93
-
94
-
95
-
96
-
97
-
98
-
99
-
100
-
101
-
102
-
 103
103 -
 104
104 -
 105
105 -
 106
106 -
 107
107 -
 108
108 -
 109
109 -
 110
110 -
 111
111 -
 112
112 -
 113
113 -
 114
114 -
 115
115 -
 116
116 -
 117
117 -
 118
118 -
 119
119 -
 120
120 -
 121
121 -
 122
122 -
 123
123 -
124
-
125
-
126
-
127
-
128
-
129
-
130
-
131
-
132
-
133
-
134
-
135
-
136
-
137
-
138
-
139
-
140
-
141
-
142
-
143
-
144
-
145
-
146
-
147
-
148
-
149
-
150
-
151
-
152
-
153
-
154
-
155
-
156
-
157
-
158
-
159
-
160
 |
 |

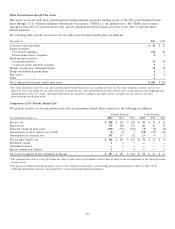
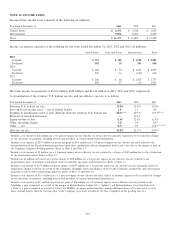
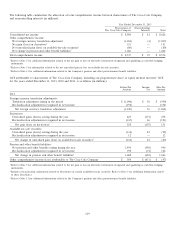
Other Postretirement Benefit Plan Assets
Plan assets associated with other postretirement benefits primarily represents funding of one of the U.S. postretirement benefit
plans through a U.S. Voluntary Employee Beneficiary Association (‘‘VEBA’’), a tax-qualified trust. The VEBA assets remain
segregated from the U.S. pension master trust and are primarily invested in liquid assets due to the level of expected future
benefit payments.
The following table presents total assets for our other postretirement benefit plans (in millions):
December 31, 2013 2012
Cash and cash equivalents $10 $13
Equity securities:
U.S.-based companies 112 81
International-based companies 84
Fixed-income securities:
Government bonds 79 78
Corporate bonds and debt securities 95
Mutual, pooled and commingled funds 18 16
Hedge funds/limited partnerships 33
Real estate 22
Other 2—
Total other postretirement benefit plan assets1$ 243 $ 202
1Fair value disclosures related to our other postretirement benefit plan assets are included in Note 16. Fair value disclosures include, but are not
limited to, the levels within the fair value hierarchy in which the fair value measurements in their entirety fall; a reconciliation of the beginning and
ending balances of Level 3 assets; and information about the valuation techniques and inputs used to measure the fair value of our other
postretirement benefit plan assets.
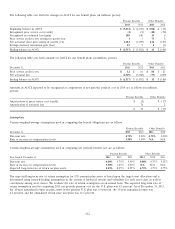
Components of Net Periodic Benefit Cost
Net periodic benefit cost for our pension and other postretirement benefit plans consisted of the following (in millions):
Pension Benefits Other Benefits
Year Ended December 31, 2013 2012 2011 2013 2012 2011
Service cost $ 280 $ 291 $ 249 $36 $34 $32
Interest cost 378 388 391 42 43 45
Expected return on plan assets1(659) (573) (508) (9) (8) (8)
Amortization of prior service cost (credit) (2) (2) 5 (10) (52) (61)
Amortization of actuarial loss 197 137 82 13 62
Net periodic benefit cost $ 194 $ 241 $ 219 $72 $23 $10
Settlement charge 133———
Curtailment charge —6————
Special termination benefits2218——3
Total cost recognized in the statements of income $ 197 $ 251 $ 230 $72 $23 $13
1The Company has elected to use the actual fair value of plan assets as the market-related value of assets in the determination of the expected return
on plan assets.
2The special termination benefits primarily relate to the Company’s productivity, restructuring and integration initiatives. Refer to Note 18 for
additional information related to our productivity, restructuring and integration initiatives.
111