Coca Cola 2013 Annual Report Download - page 57
Download and view the complete annual report
Please find page 57 of the 2013 Coca Cola annual report below. You can navigate through the pages in the report by either clicking on the pages listed below, or by using the keyword search tool below to find specific information within the annual report.-
 1
1 -
2
-
3
-
4
-
5
-
6
-
7
-
8
-
9
-
10
-
11
-
12
-
13
-
14
-
15
-
16
-
17
-
18
-
19
-
20
-
21
-
22
-
23
-
24
-
25
-
26
-
27
-
28
-
29
-
30
-
31
-
32
-
33
-
34
-
35
-
36
-
37
-
38
-
39
-
40
-
41
-
42
-
43
-
44
-
45
-
46
-
 47
47 -
 48
48 -
 49
49 -
 50
50 -
 51
51 -
 52
52 -
 53
53 -
 54
54 -
 55
55 -
 56
56 -
 57
57 -
 58
58 -
 59
59 -
 60
60 -
 61
61 -
 62
62 -
 63
63 -
 64
64 -
 65
65 -
 66
66 -
 67
67 -
68
-
69
-
70
-
71
-
72
-
73
-
74
-
75
-
76
-
77
-
78
-
79
-
80
-
81
-
82
-
83
-
84
-
85
-
86
-
87
-
88
-
89
-
90
-
91
-
92
-
93
-
94
-
95
-
96
-
97
-
98
-
99
-
100
-
101
-
102
-
103
-
104
-
105
-
106
-
107
-
108
-
109
-
110
-
111
-
112
-
113
-
114
-
115
-
116
-
117
-
118
-
119
-
120
-
121
-
122
-
123
-
124
-
125
-
126
-
127
-
128
-
129
-
130
-
131
-
132
-
133
-
134
-
135
-
136
-
137
-
138
-
139
-
140
-
141
-
142
-
143
-
144
-
145
-
146
-
147
-
148
-
149
-
150
-
151
-
152
-
153
-
154
-
155
-
156
-
157
-
158
-
159
-
160
 |
 |
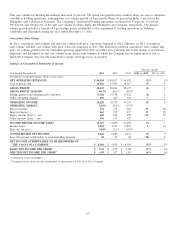
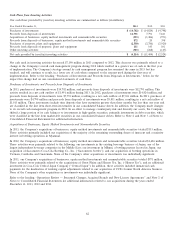
Operating income for the Latin America segment for the years ended December 31, 2013 and 2012 was $2,908 million and
$2,879 million, respectively. In 2013, operating income was unfavorably impacted by fluctuations in foreign currency exchange rates
by 10 percent. Operating income for the segment was also impacted by favorable pricing across all of the business units and
volume growth in the Latin Center and South Latin business units, partially offset by continued investments in the brands,
including investments related to the 2014 FIFA World CupTM.
North America’s operating income for the years ended December 31, 2013 and 2012 was $2,432 million and $2,597 million,
respectively. In both 2013 and 2012, operating income was minimally impacted by fluctuations in foreign currency exchange rates.
The decrease in operating income and operating margin was primarily due to unfavorable product and package mix. North
America’s operating income was also reduced by $282 million due to charges related to the Company’s productivity and
reinvestment program, as compared to $227 million of similar charges in 2012.
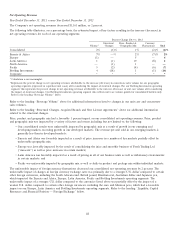
Operating income in Pacific for the years ended December 31, 2013 and 2012 was $2,478 million and $2,516 million, respectively.
In 2013, the segment’s operating income was unfavorably impacted by fluctuations in foreign currency exchange rates by 2 percent,
charges of $25 million related to the Company’s productivity and reinvestment program as well as other restructuring initiatives, as
compared to $2 million of similar charges in 2012.
Our Bottling Investments segment’s operating income for the years ended December 31, 2013 and 2012 was $115 million and
$140 million, respectively. In 2013, operating income was unfavorably impacted by fluctuations in foreign currency exchange rates
by 8 percent. Operating income was also reduced due to the deconsolidation of our Philippine and Brazilian bottling operations.
Refer to Note 2 of Notes to Consolidated Financial Statements. In addition, operating income in 2013 was reduced by
$194 million due to charges related to the Company’s productivity and reinvestment program as well as other restructuring
initiatives, as compared to $164 million of related charges in 2012.
The Corporate segment’s operating loss for the years ended December 31, 2013 and 2012 was $1,651 million and $1,391 million,
respectively. Operating loss in 2013 included impairment charges of $195 million recorded on certain of the Company’s intangible
assets. Operating loss also included charges of $120 million related to the Company’s productivity and reinvestment program as
well as other restructuring initiatives, as compared to similar charges of $33 million in 2012. Operating loss in 2013 was favorably
impacted by fluctuations in foreign currency exchange rates by 2 percent.
Based on spot rates as of the beginning of February 2014 and our hedging coverage in place, the Company expects currencies to
have a 10 percent unfavorable impact on operating income for the first quarter of 2014 and a 7 percent unfavorable impact on
operating income for the full year of 2014. Additionally, in January 2014, in an effort to control inflation, pricing and product
shortages, the Venezuelan government imposed a cap on profit margins earned by businesses in Venezuela. We are currently
evaluating the impact of this law which, along with further controls on foreign currency exchange, further devaluation or other
actions by the Venezuelan government, could have an adverse impact on our 2014 operating income.
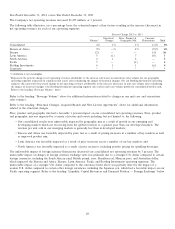
Year Ended December 31, 2012, versus Year Ended December 31, 2011
In 2012, foreign currency exchange rates unfavorably impacted consolidated operating income by 5 percent. The unfavorable
impact of changes in foreign currency exchange rates was primarily due to a stronger U.S. dollar compared to certain other
foreign currencies, including the South African rand, British pound, euro, Brazilian real, Mexican peso and Australian dollar,
which impacted the Eurasia and Africa, Europe, Latin America, Pacific and Bottling Investments operating segments. The
unfavorable impact of a stronger U.S. dollar compared to the currencies listed above was partially offset by the impact of a
weaker U.S. dollar compared to certain other foreign currencies, including the Japanese yen, which had a favorable impact on our
Pacific operating segment. Refer to the heading ‘‘Liquidity, Capital Resources and Financial Position — Foreign Exchange’’ below.
Our 2012 consolidated operating margin was favorably impacted by geographic mix. The favorable geographic mix was primarily
due to many of our emerging markets recovering from the global recession at a quicker pace than our developed markets.
Although this shift in geographic mix has a negative impact on net operating revenues, it generally has a favorable impact on our
gross profit margin and operating margin due to the correlated impact it has on our product mix. The product mix in the majority
of our emerging and developing markets is more heavily skewed toward products in our sparkling beverage portfolio, which
generally yield a higher gross profit margin compared to our still beverages and finished products. Consequently, the shift in our
geographic mix is driving favorable product mix from a global perspective.
55