Coca Cola 2013 Annual Report Download - page 142
Download and view the complete annual report
Please find page 142 of the 2013 Coca Cola annual report below. You can navigate through the pages in the report by either clicking on the pages listed below, or by using the keyword search tool below to find specific information within the annual report.-
 1
1 -
2
-
3
-
4
-
5
-
6
-
7
-
8
-
9
-
10
-
11
-
12
-
13
-
14
-
15
-
16
-
17
-
18
-
19
-
20
-
21
-
22
-
23
-
24
-
25
-
26
-
27
-
28
-
29
-
30
-
31
-
32
-
33
-
34
-
35
-
36
-
37
-
38
-
39
-
40
-
41
-
42
-
43
-
44
-
45
-
46
-
47
-
48
-
49
-
50
-
51
-
52
-
53
-
54
-
55
-
56
-
57
-
58
-
59
-
60
-
61
-
62
-
63
-
64
-
65
-
66
-
67
-
68
-
69
-
70
-
71
-
72
-
73
-
74
-
75
-
76
-
77
-
78
-
79
-
80
-
81
-
82
-
83
-
84
-
85
-
86
-
87
-
88
-
89
-
90
-
91
-
92
-
93
-
94
-
95
-
96
-
97
-
98
-
99
-
100
-
101
-
102
-
103
-
104
-
105
-
106
-
107
-
108
-
109
-
110
-
111
-
112
-
113
-
114
-
115
-
116
-
117
-
118
-
119
-
120
-
121
-
122
-
123
-
124
-
125
-
126
-
127
-
128
-
129
-
130
-
131
-
 132
132 -
 133
133 -
 134
134 -
 135
135 -
 136
136 -
 137
137 -
 138
138 -
 139
139 -
 140
140 -
 141
141 -
 142
142 -
 143
143 -
 144
144 -
 145
145 -
 146
146 -
 147
147 -
 148
148 -
 149
149 -
 150
150 -
 151
151 -
 152
152 -
153
-
154
-
155
-
156
-
157
-
158
-
159
-
160
 |
 |

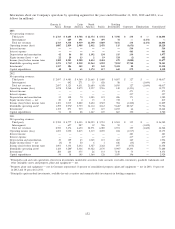
Quarterly Data (Unaudited)
First Second Third Fourth
Quarter Quarter Quarter Quarter Full Year
(In millions except per share data)
2013
Net operating revenues $ 11,035 $ 12,749 $ 12,030 $ 11,040 $ 46,854
Gross profit 6,711 7,760 7,237 6,725 28,433
Net income attributable to shareowners of The Coca-Cola Company 1,751 2,676 2,447 1,710 8,584
Basic net income per share $ 0.39 $ 0.60 $ 0.55 $ 0.39 $ 1.941
Diluted net income per share $ 0.39 $ 0.59 $ 0.54 $ 0.38 $ 1.90
2012
Net operating revenues $ 11,137 $ 13,085 $ 12,340 $ 11,455 $ 48,017
Gross profit 6,789 7,861 7,487 6,827 28,964
Net income attributable to shareowners of The Coca-Cola Company 2,054 2,788 2,311 1,866 9,019
Basic net income per share $ 0.45 $ 0.62 $ 0.51 $ 0.42 $ 2.00
Diluted net income per share $ 0.45 $ 0.61 $ 0.50 $ 0.41 $ 1.97
1The sum of the quarterly net income per share amounts do not agree to the full year net income per share amounts. We calculate net income per
share based on the weighted-average number of outstanding shares during the reporting period. The average number of shares fluctuates throughout
the year and can therefore produce a full year result that does not agree to the sum of the individual quarters.
Our first quarter, second quarter and third quarter reporting periods end on the Friday closest to the last day of the applicable
quarterly calendar period. Our fourth quarter and fiscal year end on December 31 regardless of the day of the week on which
December 31 falls.
The Company’s first quarter 2013 results were impacted by two fewer shipping days compared to the first quarter of 2012.
Furthermore, the Company recorded the following transactions which impacted results:
• Charges of $2 million for Eurasia and Africa, $82 million for North America, $8 million for Pacific, $21 million for Bottling
Investments and $10 million for Corporate due to the Company’s productivity and reinvestment program as well as other
restructuring initiatives. Refer to Note 17 and Note 18.
• Charges of $9 million for Bottling Investments and $140 million for Corporate due to the devaluation of the Venezuelan
bolivar, including our proportionate share of the charge incurred by an equity method investee that has operations in
Venezuela. Refer to Note 17 and Note 18.
• Net charge of $30 million for Bottling Investments due to the Company’s proportionate share of unusual or infrequent
items recorded by certain of our equity method investees. Refer to Note 17.
In the second quarter of 2013, the Company recorded the following transactions which impacted results:
• Charges of $6 million for Europe, $55 million for North America, $6 million for Pacific, $20 million for Bottling
Investments and $46 million for Corporate due to the Company’s productivity and reinvestment program as well as other
restructuring initiatives. Refer to Note 17 and Note 18.
• Charge of $144 million for Corporate due to a loss related to the then pending merger of four of the Company’s Japanese
bottling partners. Refer to Note 17.
• Benefit of $139 million for Corporate due to a gain the Company recognized as a result of Coca-Cola FEMSA issuing
additional shares of its own stock during the period at a per share amount greater than the carrying value of the
Company’s per share investment. Refer to Note 17.
• Charge of $23 million for Corporate due to the early extinguishment of certain long-term debt. Refer to Note 10.
In the third quarter of 2013, the Company recorded the following transactions which impacted results:
• Charges of $1 million for Europe, $53 million for North America, $2 million for Pacific, $45 million for Bottling
Investments and $41 million for Corporate due to the Company’s productivity and reinvestment program as well as other
restructuring initiatives. Refer to Note 17 and Note 18.
140