Coca Cola 2013 Annual Report Download - page 127
Download and view the complete annual report
Please find page 127 of the 2013 Coca Cola annual report below. You can navigate through the pages in the report by either clicking on the pages listed below, or by using the keyword search tool below to find specific information within the annual report.-
 1
1 -
2
-
3
-
4
-
5
-
6
-
7
-
8
-
9
-
10
-
11
-
12
-
13
-
14
-
15
-
16
-
17
-
18
-
19
-
20
-
21
-
22
-
23
-
24
-
25
-
26
-
27
-
28
-
29
-
30
-
31
-
32
-
33
-
34
-
35
-
36
-
37
-
38
-
39
-
40
-
41
-
42
-
43
-
44
-
45
-
46
-
47
-
48
-
49
-
50
-
51
-
52
-
53
-
54
-
55
-
56
-
57
-
58
-
59
-
60
-
61
-
62
-
63
-
64
-
65
-
66
-
67
-
68
-
69
-
70
-
71
-
72
-
73
-
74
-
75
-
76
-
77
-
78
-
79
-
80
-
81
-
82
-
83
-
84
-
85
-
86
-
87
-
88
-
89
-
90
-
91
-
92
-
93
-
94
-
95
-
96
-
97
-
98
-
99
-
100
-
101
-
102
-
103
-
104
-
105
-
106
-
107
-
108
-
109
-
110
-
111
-
112
-
113
-
114
-
115
-
116
-
 117
117 -
 118
118 -
 119
119 -
 120
120 -
 121
121 -
 122
122 -
 123
123 -
 124
124 -
 125
125 -
 126
126 -
 127
127 -
 128
128 -
 129
129 -
 130
130 -
 131
131 -
 132
132 -
 133
133 -
 134
134 -
 135
135 -
 136
136 -
 137
137 -
138
-
139
-
140
-
141
-
142
-
143
-
144
-
145
-
146
-
147
-
148
-
149
-
150
-
151
-
152
-
153
-
154
-
155
-
156
-
157
-
158
-
159
-
160
 |
 |

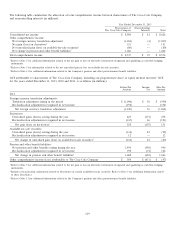
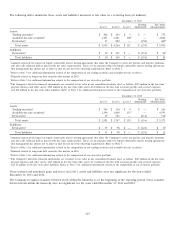
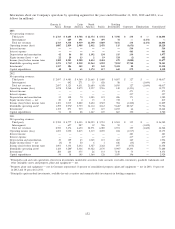
Pension Plan Assets
The following table summarizes the levels within the fair value hierarchy for our pension plan assets as of December 31, 2013 and
2012 (in millions):
December 31, 2013 December 31, 2012
Level 1 Level 2 Level 3 Total Level 1 Level 2 Level 3 Total
Cash and cash equivalents $ 331 $ 183 $ — $ 514 $ 187 $ 199 $ — $ 386
Equity securities:
U.S.-based companies 1,680 7 15 1,702 1,847 20 14 1,881
International-based companies 1,271 13 — 1,284 910 54 — 964
Fixed-income securities:
Government bonds — 719 49 768 — 562 — 562
Corporate bonds and debt securities — 1,466 40 1,506 — 982 — 982
Mutual, pooled and commingled funds 56 1,531 — 1,587 504 1,006 — 1,510
Hedge funds/limited partnerships — 190 353 543 — 125 400 525
Real estate — — 251 251 — — 257 257
Other — 7 5841591 — 7 5101517
Total $ 3,338 $ 4,116 $ 1,292 $ 8,746 $ 3,448 $ 2,955 $ 1,181 $ 7,584
1Includes purchased annuity contracts and insurance-linked securities.
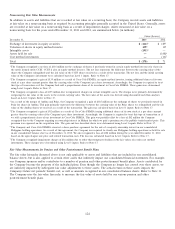
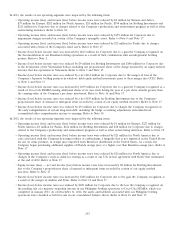
The following table provides a reconciliation of the beginning and ending balance of Level 3 assets for our U.S. and non-U.S.
pension plans for the years ended December 31, 2013 and 2012 (in millions):
Corporate Mutual,
Bonds and Hedge Pooled and
Debt Funds/Limited Real Equity Commingled
Securities Partnerships Estate Securities Funds Other Total
2012
Balance at beginning of year $ — $ 349 $ 270 $ 20 $ 5 $ 518 $ 1,162
Actual return on plan assets:
Related to assets still held at the reporting date — (8) 13 — — 1 6
Related to assets sold during the year — 24 3 — — — 27
Purchases, sales and settlements — net — 35 (27) — (5) (2) 1
Transfers in or out of Level 3 — net — — (2) (6) — (4) (12)
Foreign currency translation — — — — — (3) (3)
Balance at end of year $ — $ 400 $ 257 $ 14 $ — $ 5101$ 1,181
2013
Balance at beginning of year $ — $ 400 $ 257 $ 14 $ — $ 510 $ 1,181
Actual return on plan assets:
Related to assets still held at the reporting date (4) (6) 13 — — 39 42
Related to assets sold during the year (2) 24 6 — — — 28
Purchases, sales and settlements — net 95 14 (24) 1 — 193 279
Transfers in or out of Level 3 — net — (78) — — — (172) (250)
Foreign currency translation — (1) (1) — — 14 12
Balance at end of year $ 89 $ 353 $ 251 $ 15 $ — $ 5841$ 1,292
1Includes purchased annuity contracts and insurance-linked securities.
125