Coca Cola 2013 Annual Report Download - page 66
Download and view the complete annual report
Please find page 66 of the 2013 Coca Cola annual report below. You can navigate through the pages in the report by either clicking on the pages listed below, or by using the keyword search tool below to find specific information within the annual report.-
 1
1 -
2
-
3
-
4
-
5
-
6
-
7
-
8
-
9
-
10
-
11
-
12
-
13
-
14
-
15
-
16
-
17
-
18
-
19
-
20
-
21
-
22
-
23
-
24
-
25
-
26
-
27
-
28
-
29
-
30
-
31
-
32
-
33
-
34
-
35
-
36
-
37
-
38
-
39
-
40
-
41
-
42
-
43
-
44
-
45
-
46
-
47
-
48
-
49
-
50
-
51
-
52
-
53
-
54
-
55
-
 56
56 -
 57
57 -
 58
58 -
 59
59 -
 60
60 -
 61
61 -
 62
62 -
 63
63 -
 64
64 -
 65
65 -
 66
66 -
 67
67 -
 68
68 -
 69
69 -
 70
70 -
 71
71 -
 72
72 -
 73
73 -
 74
74 -
 75
75 -
 76
76 -
77
-
78
-
79
-
80
-
81
-
82
-
83
-
84
-
85
-
86
-
87
-
88
-
89
-
90
-
91
-
92
-
93
-
94
-
95
-
96
-
97
-
98
-
99
-
100
-
101
-
102
-
103
-
104
-
105
-
106
-
107
-
108
-
109
-
110
-
111
-
112
-
113
-
114
-
115
-
116
-
117
-
118
-
119
-
120
-
121
-
122
-
123
-
124
-
125
-
126
-
127
-
128
-
129
-
130
-
131
-
132
-
133
-
134
-
135
-
136
-
137
-
138
-
139
-
140
-
141
-
142
-
143
-
144
-
145
-
146
-
147
-
148
-
149
-
150
-
151
-
152
-
153
-
154
-
155
-
156
-
157
-
158
-
159
-
160
 |
 |

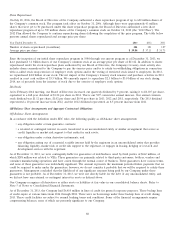
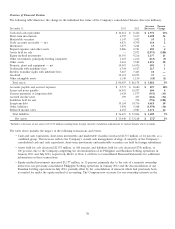
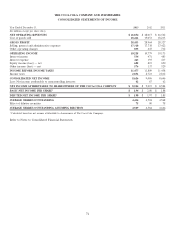
Cash Flows from Financing Activities
Our cash flows provided by (used in) financing activities were as follows (in millions):
Year Ended December 31, 2013 2012 2011
Issuances of debt $ 43,425 $ 42,791 $ 27,495
Payments of debt (38,714) (38,573) (22,530)
Issuances of stock 1,328 1,489 1,569
Purchases of stock for treasury (4,832) (4,559) (4,513)
Dividends (4,969) (4,595) (4,300)
Other financing activities 17 100 45
Net cash provided by (used in) financing activities $ (3,745) $ (3,347) $ (2,234)
Debt Financing
Our Company maintains debt levels we consider prudent based on our cash flows, interest coverage ratio and percentage of debt
to capital. We use debt financing to lower our overall cost of capital, which increases our return on shareowners’ equity. This
exposes us to adverse changes in interest rates. Our interest expense may also be affected by our credit ratings.
As of December 31, 2013, our long-term debt was rated ‘‘AA-’’ by Standard & Poor’s, ‘‘Aa3’’ by Moody’s and ‘‘A+’’ by Fitch. Our
commercial paper program was rated ‘‘A-1+’’ by Standard & Poor’s, ‘‘P-1’’ by Moody’s and ‘‘F-1’’ by Fitch. In assessing our credit
strength, all three agencies consider our capital structure (including the amount and maturity dates of our debt) and financial
policies as well as the aggregated balance sheet and other financial information of the Company. In addition, some rating agencies
also consider the financial information of certain bottlers, including New CCE, Coca-Cola Amatil Limited, Coca-Cola Bottling Co.
Consolidated, Coca-Cola FEMSA and Coca-Cola Hellenic. While the Company has no legal obligation for the debt of these
bottlers, the rating agencies believe the strategic importance of the bottlers to the Company’s business model provides the
Company with an incentive to keep these bottlers viable. It is our expectation that the credit rating agencies will continue using
this methodology. If our credit ratings were to be downgraded as a result of changes in our capital structure, our major bottlers’
financial performance, changes in the credit rating agencies’ methodology in assessing our credit strength, or for any other reason,
our cost of borrowing could increase. Additionally, if certain bottlers’ credit ratings were to decline, the Company’s equity income
could be reduced as a result of the potential increase in interest expense for those bottlers.
In February 2014, Fitch affirmed the Company’s A+ long-term debt rating and F-1 commercial paper rating, but revised its rating
outlook from stable to negative. The Company does not believe that a downgrade would have a material adverse effect on our
cost of borrowing.
We monitor our financial ratios and, as indicated above, the rating agencies consider these ratios in assessing our credit ratings.
Each rating agency employs a different aggregation methodology and has different thresholds for the various financial ratios.
These thresholds are not necessarily permanent, nor are they always fully disclosed to our Company.
Our global presence and strong capital position give us access to key financial markets around the world, enabling us to raise
funds at a low effective cost. This posture, coupled with active management of our mix of short-term and long-term debt and our
mix of fixed-rate and variable-rate debt, results in a lower overall cost of borrowing. Our debt management policies, in conjunction
with our share repurchase programs and investment activity, can result in current liabilities exceeding current assets.
Issuances and payments of debt included both short-term and long-term financing activities. On December 31, 2013, we had
$6,410 million in lines of credit available for general corporate purposes. These backup lines of credit expire at various times from
2014 through 2018. There were no borrowings under these backup lines of credit during 2013. These credit facilities are subject to
normal banking terms and conditions.
In 2013, the Company had issuances of debt of $43,425 million, which included $35,944 million of issuances of commercial paper
and short-term debt with maturities greater than 90 days. The Company’s total issuances of debt also included long-term debt
issuances of $7,481 million, net of related discounts and issuance costs.
64